
| MATLAB Function Reference |   |
表示
ezplot(f)
ezplot(f,[min,max])
ezplot(f,[xmin,xmax,ymin,ymax])
ezplot(x,y)
ezplot(x,y,[tmin,tmax])
ezplot(...,figure)
詳細
ezplot(f) は、デフォルトの領域 -2 < x < 2
 で、表現 f = f(x) をプロットします。
ezplot(f,[min,max]) は、領域 min < x < max で、f = f(x) をプロットします。
ezplot(f) は、デフォルトの領域 -2 < x < 2
 , -2
, -2 < y < 2
 で、f(x,y) = 0 をプロットします。
ezplot(f,[xmin,xmax,ymin,ymax]) は、xmin < x < xmax と ymin < y < ymax で、f(x,y) = 0 をプロットします。
ezplot(f,[min,max]) は、min < x < max と min < y < max で、f(x,y) = 0 をプロットします。
f が、(変数 x と y ではなく)u と v の関数の場合、領域の端点 umin, umax, vmin, vmax は、アルファベット順にソートされます。それで、ezplot('u^2 - v^2 - 1',[-3,2,-2,3]) は、-3 < u < 2, -2 < v < 3 の範囲で、u2 - v2 - 1 = 0 をプロットします。
ezplot(x,y) は、デフォルト領域 0 < t < 2 で、パラメータを使って定義された平面 x = x(t) and y = y(t) をプロットします。
ezplot(x,y,[tmin,tmax]) は、tmin < t < tmax で、x = x(t) and y = y(t) をプロットします。
ezplot(...,figure) は、ハンドル figure で識別できるフィギュアウインドウ内に、指定した領域で、設定した関数をプロットします。
注意
配列乗算、除算、指数は、ezplotに渡す表現で、常に使われます。たとえば、つぎの表現のMATLAB シンタックス
x.^2 - y.^2
ezplot('x^2 - y^2')
これは、x^2 が、ezplot に渡す文字列の中を x.^2 と解釈します。
例題
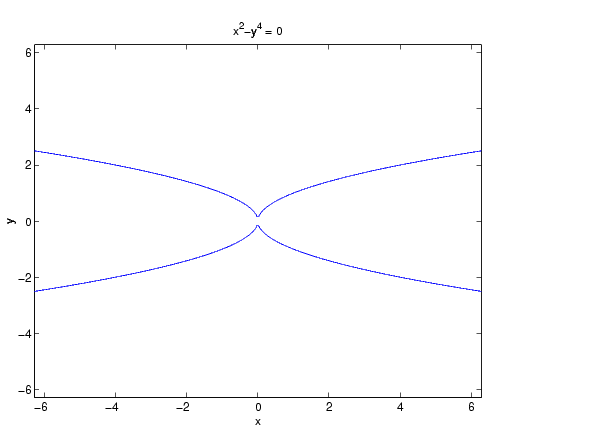
ezplot('x^2-y^4')

参考
ezcontour, ezcontourf, ezmesh, ezmeshc, ezplot3, ezpolar, ezsurf, ezsurfc, plot
 | ezmeshc | ezplot3 |  |