| Model Browser User's Guide | |
The Data Editor
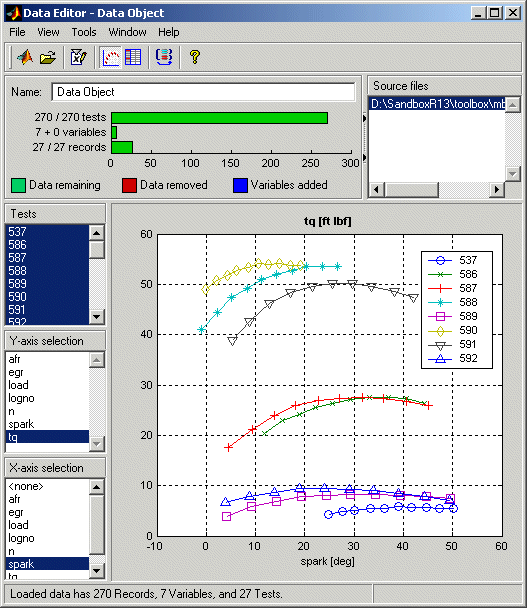
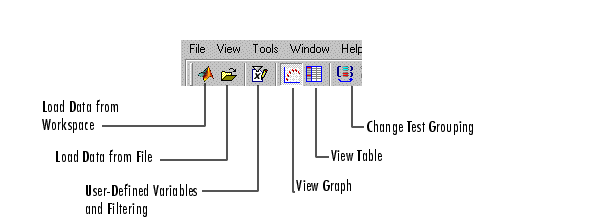
As can be seen in the preceding example, in the default Graph view you can select combinations of variables from the list boxes on the left and view all tests. Multiple selection of tests and y-axis variables is possible -- in the example, multiple tests are selected to view several tests simultaneously. In the Table view (toolbar button and View menu), you can edit and add records. See Data Editor Toolbar and Menus.
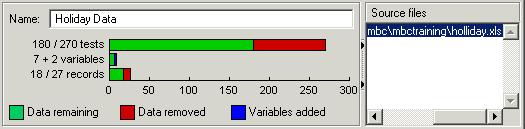
The list box at the top right contains the source file information for the data, and other information is displayed on the left: the name of the data set and the numbers of records, variables, and tests it contains. See the preceding example.
The bars and figures on the left show the proportion of records removed by any filters applied, and the number of user-defined variables is shown. For this example with two user-defined variable added to a data set originally containing seven variables, you see `Variables 7 + 2'.
By default the new data set is called Data Object. You can change this name in the Name edit box at the top of the window.
See Data Editor Toolbar and Menus for other controls.
You can also change the names of data sets at the project node by select-clicking a data set in the Data Sets list, or by pressing F2 (as when selecting to rename in Windows Explorer).
There is a right-click menu on the plot, to show the legend (only applicable for multiple selections), the grid, and the line. This line joins the data points. Reorder points redraws the line joining the points in order from left to right. The line might not make sense when drawn in the order of the records.
| Note Dismissing the Data Editor automatically brings up the Data Wizard if you entered it from the test plan level. |
Data Editor Toolbar and Menus
The Window and Help menus are the same as everywhere else in the Model Browser. See Window Menu and Help Menu.
File Menu
View Menu
Tools Menu
| | Data | Data Loading and Merging | |