
| Curve Fitting Toolbox |   |
Marking Outliers
Outliers are defined as individual data points that you exclude from a fit because they are inconsistent with the statistical nature of the bulk of the data, and will adversely affect the fit results. Outliers are often readily identified by a scatter plot of response data versus predictor data.
Marking outliers with the Curve Fitting Toolbox follows these rules:
As described in Parametric Fitting, one of the basic assumptions underlying curve fitting is that the data is statistical in nature and is described by a particular distribution, which is often assumed to be Gaussian. The statistical nature of the data implies that it contains random variations along with a deterministic component.
However, your data set might contain one or more data points that are nonstatistical in nature, or are described by a different statistical distribution. These data points might be easy to identify, or they might be buried in the data and difficult to identify.
A nonstatistical process can involve the measurement of a physical variable such as temperature or voltage in which the random variation is negligible compared to the systematic errors. For example, if your sensor calibration is inaccurate, the data measured with that sensor will be systematically inaccurate. In some cases, you might be able to quantify this nonstatistical data component and correct the data accordingly. However, if the scatter plot reveals that a handful of response values are far removed from neighboring response values, these data points are considered outliers and should be excluded from the fit. Outliers are usually difficult to explain away. For example, it might be that your sensor experienced a power surge or someone wrote down the wrong number in a log book.
If you decide there is justification, you should mark outliers to be excluded from subsequent fits -- particularly parametric fits. Removing these data points can have a dramatic effect on the fit results because the fitting process minimizes the square of the residuals. If you do not exclude outliers, the resulting fit will be poor for a large portion of your data. Conversely, if you do exclude the outliers and choose the appropriate model, the fit results should be reasonable.
Because outliers can have a significant effect on a fit, they are considered influential data. However, not all influential data points are outliers. For example, your data set can contain valid data points that are far removed from the rest of the data. The data is valid because it is well described by the model used in the fit. The data is influential because its exclusion will dramatically affect the fit results.
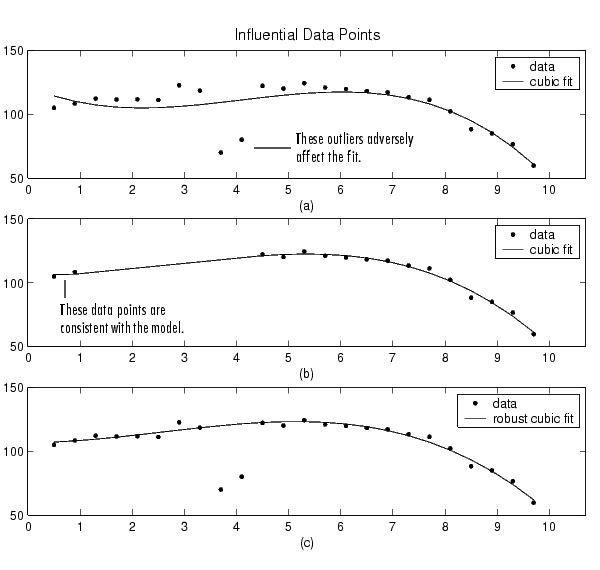
Two types of influential data points are shown below for generated data. Also shown are cubic polynomial fits and a robust fit that is resistant to outliers.

Plot (a) shows that the two influential data points are outliers and adversely affect the fit. Plot (b) shows that the two influential data points are consistent with the model and do not adversely affect the fit. Plot (c) shows that a robust fitting procedure is an acceptable alternative to marking outliers for exclusion. Robust fitting is described in Robust Least Squares.
 | Excluding and Sectioning Data | Sectioning |  |