| Curve Fitting Toolbox |
  |
Excluding and Sectioning Data
If there is justification, you might want to exclude part of a data set from a fit. Typically, you exclude data so that subsequent fits are not adversely affected. For example, if you are fitting a parametric model to measured data that has been corrupted by a faulty sensor, the resulting fit coefficients will be inaccurate.
The Curve Fitting Toolbox provides two methods to exclude data:
- Marking Outliers -- Outliers are defined as individual data points that you exclude because they are inconsistent with the statistical nature of the bulk of the data.
- Sectioning -- Sectioning excludes a window of response or predictor data. For example, if many data points in a data set are corrupted by large systematic errors, you might want to section them out of the fit.
For each of these methods, you must create an exclusion rule, which captures the range, domain, or index of the data points to be excluded.
To exclude data while fitting, you use the Fitting GUI to associate the appropriate exclusion rule with the data set to be fit. Refer to Example: Robust Fit for more information about fitting a data set using an exclusion rule.
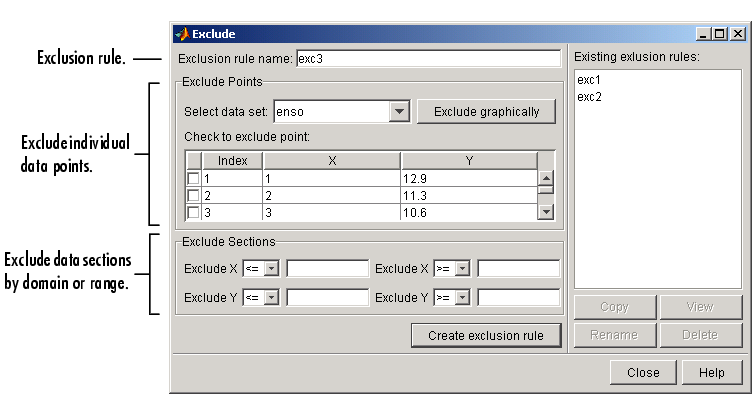
You mark data to be excluded from a fit with the Exclude GUI, which you open from the Curve Fitting Tool. The GUI is shown below followed by a description of its features.

Exclusion Rule
- Exclusion rule name -- Specify the name of the exclusion rule that identifies the data points to be excluded from subsequent fits.
- Existing exclusion rules -- Lists the names of all exclusion rules created during the current session. When you select an existing exclusion rule, you can perform these actions:
- Click Copy to copy the exclusion rule. The exclusions associated with the original exclusion rule are recreated in the GUI. You can modify these exclusions and then click Create exclusion rule to save them to the copied rule.
- Click Rename to change the name of the exclusion rule.
- Click Delete to delete the exclusion rule. To select multiple exclusion rules, you can use the Ctrl key and the mouse to select exclusion rules one by one, or you can use the Shift key and the mouse to select a range of exclusion rules.
- Click View to display the exclusion rule graphically. If a data set is associated with the exclusion rule, the data is also displayed.
Exclude Individual Data Points
- Select data set -- Select the data set from which data points will be marked as excluded. You must select a data set to exclude individual data points.
- Exclude graphically -- Open a GUI that allows you to exclude individual data points graphically.
- Individually excluded data points are marked by an "
x" in the GUI, and are automatically identified in the Check to exclude point table.
- Check to exclude point -- Select individual data points to exclude. You can sort this table by clicking on any of the column headings.
Exclude Data Sections by Domain or Range
- Section -- Specify a vertical window, a horizontal window, or a box of data points to include. The excluded data lie outside these windows. You do not need to select a data set to create an exclusion rule by sectioning.
- Exclude X -- Section the predictor data by specifying the domain outside of which data is excluded.
- Exclude Y -- Section the response data by specifying the range outside of which data is excluded.
 | Example: Smoothing Data | | Marking Outliers |  |


