| CAGE User's Guide |
  |
Viewing the Comparison Pane
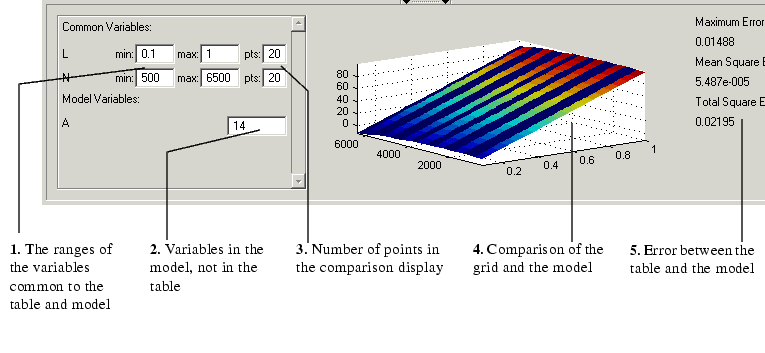
To view the comparison pane, select View -> Comparison. Alternatively, click  , the "snapper point" at the bottom of the normalizer display panes. This is labeled in the diagram of the Normalizer View.

The comparison pane displays a comparison between the following:
- A full factorial grid filled using these breakpoints
- The model
| Note
This is not a comparison between the current table values and the model. To compare the current table values and the model, see Calibrating the Tables.
|
To make full use of the comparison pane:
- Adjust the ranges of the variables that are common to the model and table.
- Adjust the values selected for any variables in the model that are not in the selected table.
- The default for this is the set point of the variable, as specified in the variable dictionary. For more information, see Using Set Points in the Variable Dictionary.
- Check the number of points at which the display is calculated.
- Check the comparison between the table and the model.
- Right-click the comparison graph to view the error display.
- Check some of the error statistics for the comparison, and use the comparison to locate where improvements can be made.
Error Display
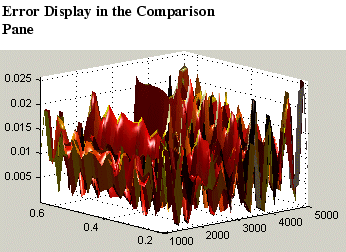
The comparison pane can also be used to display the error between the model and the strategy.

To display the error:
- Right-click the axes of the comparison display.
- Select Error from the menu.
This changes the graph to display the error between the model and the strategy.
You can display the error data in one of the following ways:
- Error. This is the difference between the feature and the model.
- Squared Error. This is the error squared.
- Absolute Error. This is the absolute value of the error.
- Relative Error (%). This is the error as a percentage of the value of the model.
- Absolute Relative Error (%). This the absolute value of the relative error.
To select one of these displays of the error data:
- Right-click the display.
- Select Error Display and select the appropriate display of the error from the context menu.
See Also
- This describes the comparison made when a table node is selected in the branch display.
 | Breakpoint Spacing Display and Deleting Breakpoints | | Feature Calibrations |  |


 , the "snapper point" at the bottom of the normalizer display panes. This is labeled in the diagram of the Normalizer View.
