| GARCH Toolbox | |
Plot or return computed sample partial auto-correlation function
Syntax
Arguments
Series |
Vector of observations of a univariate time series for which parcorr returns or plots the sample partial auto-correlation function (partial ACF). The last element of Series contains the most recent observation of the stochastic sequence. |
nLags |
(optional) Positive, scalar integer indicating the number of lags of the partial ACF to compute. If nLags = [] or is not specified, parcorr computes the partial ACF sequence at lags 0, 1, 2, ..., T, where T = min([20, length(Series)-1]). |
R |
(optional) Nonnegative integer scalar indicating the number of lags beyond which parcorr assumes the theoretical partial ACF is zero. Assuming that Series is an AR(R) process, the estimated partial ACF coefficients at lags > R are approximately zero-mean, independently distributed Gaussian variates. In this case, the standard error of the estimated partial ACF coefficients of a fitted Series with N observations is approximately 1 /  N for lags N for lags > R. If R = [] or is not specified, the default is 0. The value of R must be < nLags. |
nSTDs |
(optional) Positive scalar indicating the number of standard deviations of the sample partial ACF estimation error to display, assuming that Series is an AR(R) process. If the Rth regression coefficient (i.e., the last ordinary least squares (OLS) regression coefficient of Series regressed on a constant and R of its lags) includes N observations, specifying nSTDs results in confidence bounds at ±(nSTDs / N). If nSTDs = [] or is not specified, the default is 2 (i.e., approximate 95 percent confidence interval). |
Description
parcorr(Series, nLags, R, nSTDs)
computes and plots the sample partial auto-correlation function (partial ACF) of a univariate, stochastic time series. parcorr computes the partial ACF by fitting successive autoregressive models of orders 1, 2, ... by ordinary least squares, retaining the last coefficient of each regression. To plot the partial ACF sequence without the confidence bounds, set nSTDs = 0.
[PartialACF, Lags, Bounds] = parcorr(Series, nLags, R, nSTDs)
computes and returns the partial ACF sequence.
Example
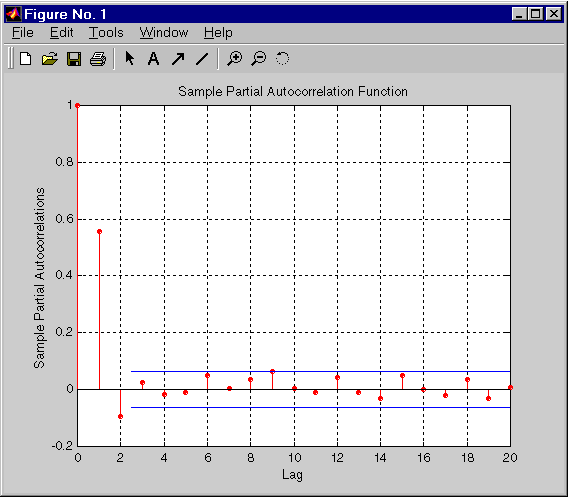
Create a stationary AR(2) process from a sequence of 1000 Gaussian deviates, and then visually assess whether the partial ACF is zero for lags > 2.
randn('state',0)                % Start from a known state.
x = randn(1000,1);              % 1000 Gaussian deviates ~ N(0,1).
y = filter(1,[1 -0.6 0.08],x);  % Create a stationary AR(2)
                                % process.
[PartialACF, Lags, Bounds] = parcorr(y , [] , 2); % Compute the
                                % partial ACF with 95 percent
                                % confidence.
[Lags, PartialACF]

ans =

         0    1.0000
    1.0000    0.5570
    2.0000   -0.0931
    3.0000    0.0249
    4.0000   -0.0180
    5.0000   -0.0099
    6.0000    0.0483
    7.0000    0.0058
    8.0000    0.0354
    9.0000    0.0623
   10.0000    0.0052
   11.0000   -0.0109
   12.0000    0.0421
   13.0000   -0.0086
   14.0000   -0.0324
   15.0000    0.0482
   16.0000    0.0008
   17.0000   -0.0192
   18.0000    0.0348
   19.0000   -0.0320
   20.0000    0.0062

Bounds

Bounds =

    0.0633
   -0.0633

parcorr(y , [] , 2)            % Use the same example, but plot
                               % the partial ACF sequence with
                               % confidence bounds.
filter (in the online MATLAB Function Reference)
References
[1] Box, G.E.P., G.M. Jenkins, G.C. Reinsel, Time Series Analysis: Forecasting and Control, third edition, Prentice Hall, 1994.
[2] Hamilton, J.D., Time Series Analysis, Princeton University Press, 1994.
| | lratiotest | price2ret | |