| Communications Blockset |
  |
Discrete-Time Signal Trajectory Scope
Display a modulated signal in its signal space by plotting its in-phase component versus its quadrature component
Library
Comm Sinks
Description

The Discrete-Time Signal Trajectory Scope displays the trajectory of a modulated signal in its signal space by plotting its in-phase component versus its quadrature component.
The Discrete-Time Signal Trajectory Scope block has one input port. The input signal must be complex. The input signal must be a sample-based scalar in sample-based mode. The input must be a frame-based column vector or a scalar in frame-based mode.
Example: Viewing the Signal Trajectory of a Modulated Signal
The following model shows the signal trajectory of a modulated signal. The model modulates a random signal using the QPSK Modulator block and then filters the signal with a raised cosine interpolation filter.

To build the model, gather and configure the following blocks:
- Random Integer Generator, in the Data Sources sublibrary of the Comm Sources library, with default parameters
- QPSK Modulator Baseband, in PM in the Digital Baseband sublibrary of the Modulation library of the Communications Blockset, with default parameters
- AWGN Channel, in the Channels library of the Communications Blockset, with the following changes to the default parameter settings:
- Set Mode to Signal-to-noise ratio (SNR).
- Set SNR (dB) to
15.
- FIR Interpolation, in the Multirate Filters sublibrary of the Filtering library of the DSP Blockset, with the following changes to the default parameter settings:
- Set FIR Filter Coefficients to
rcosine(1, 8,[], 0.5,3).
- Set Interpolation factor to
8.
- Discrete-Time Signal Trajectory Scope, in the Comms Sinks library, with the following changes to the default parameter settings:
- Set Samples per symbol to
8.
- Set Symbols displayed to
7.
- Set New symbols per display to
10.
When you run the model for 50 seconds, the Discrete-Time Signal Trajectory Scope displays the following trajectory.
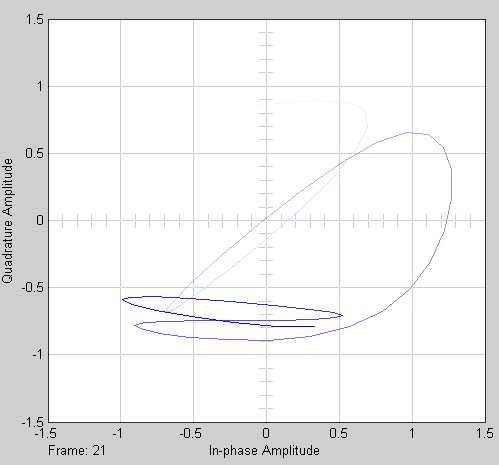
The plot displays 40 symbols. Because the Color fading check box in the Rendering Properties group is selected, symbols are displayed less brightly the older they are.
For another example, see Example: Viewing a Sinusoid.
See the reference page for the Discrete-Time Scatter Plot Scope block to compare the preceding signal trajectory with the scatter plot of the same signal. The Discrete-Time Signal Trajectory Scope block connects the points displayed by the Discrete-Time Scatter Plot Scope block to display the signal trajectory.
If you increase Symbols displayed to 100, the model produces the following signal trajectory.
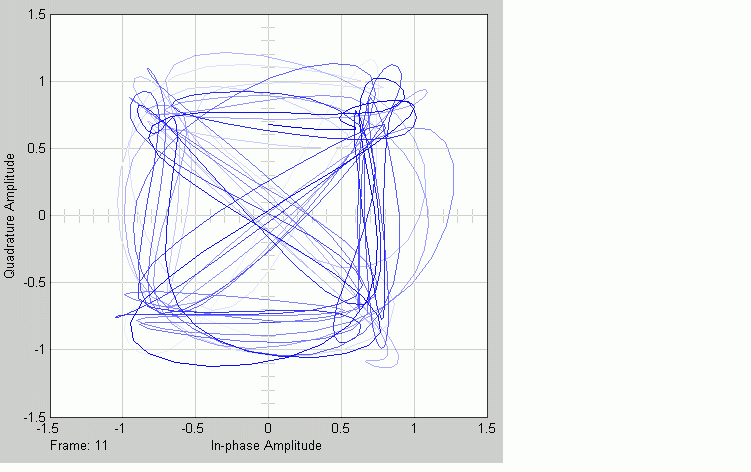
The total number of points displayed at any instant is 800, which is the product of the parameters Samples per symbol and Symbols displayed.
For another example, see Example: Viewing a Sinusoid.
Line Style and Color
The Line style and Line color parameters in the Rendering Properties group control the appearance of the signal trajectory. The Line style parameter specifies the style for lines in the signal trajectory. For details on the options for these parameters, see the reference page for the Discrete-Time Eye Diagram Scope block.
Recommended Settings
The following table summarizes the recommended parameter settings for the Discrete-Time Signal Trajectory Scope.
Parameter
|
Recommended Setting
|
Samples per symbol
|
Same as the Samples per symbol setting in the modulator block, or the Interpolation factor used in the interpolation block
|
Symbols displayed
|
10 times the alphabet size of the modulator, M
|
New symbols per display
|
Same as Symbols displayed for greater speed
A small positive integer for best animation
|
Line style
|
Solid dash (-)
|
Line color
|
Blue (b)
|
Color fading
|
Check Color fading for animation that resembles an oscilloscope.
Clear for greater speed and animation that resembles a plot.
|
High quality rendering
|
Check High quality rendering for higher quality rendering.
Clear for greater speed.
|
Open at start of simulation
|
Check Open at start of simulation to view the signal at the start of simulation.
Clear to view the signal after convergence to steady state and for greater initial speed.
|
Y-axis minimum
|
Approximately 10% less than the expected minimum value of the signal
|
Y-axis maximum
|
Approximately 10% greater than the expected maximum value of the signal
|
Dialog Box
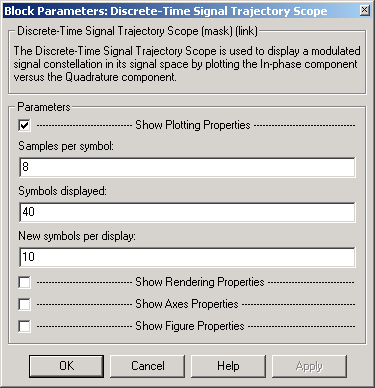
- Show Plotting Properties
- Select to display plotting properties.
- Samples per symbol
- Number of samples per symbol.
- Symbols displayed
- Total number of symbols plotted.
- New symbols per display
- Number of new symbols that appear in each display.
- Show Rendering Properties
- Select to display rendering properties, as shown in the following figure.
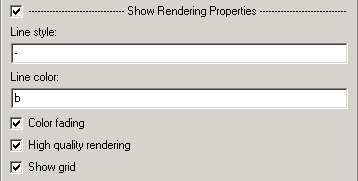
- Line markers
- The line markers used in the signal trajectory. Tunable.
- Line color
- The line color used in the signal trajectory. Tunable.
- Color fading
- When selected, the points in the signal trajectory fade as the interval of time after they are first plotted increases. Tunable.
- High quality rendering
- When selected, the block renders a slow, higher-quality picture with overwrite raster operations. When cleared, the block renders a fast, lower-quality picture with XOR raster operations. Tunable.
- Show grid
- Toggles the scope grid on and off. Tunable.
- Show Axes Properties
- Select to display axes properties, as shown in the following figure.
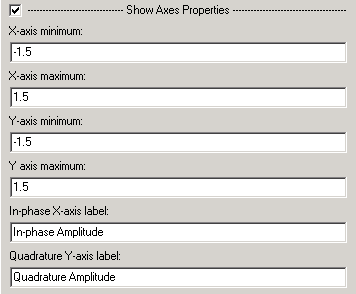
- X-axis minimum
- Minimum value the scope displays on the x-axis. Tunable.
- X-axis maximum
- Maximum value the scope displays on the x-axis. Tunable.
- Y-axis minimum
- Minimum signal value the scope displays on the y-axis. Tunable.
- Y-axis maximum
- Maximum signal value the scope display on the y-axis. Tunable.
- In-phase X-axis label
- Label for x-axis. Tunable.
- Quadrature Y-axis label
- Label for y-axis. Tunable.
- Show Figure Properties
- Select to display figure properties, as shown in the following figure.
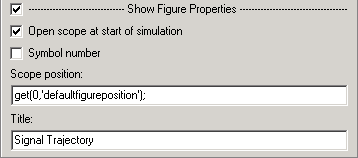
- Open at start of simulation
- When selected, the scope opens at the start of simulation. When cleared, you must double-click the block after the start of simulation to open the scope. Tunable
- Symbol number
- Displays the number of the current symbol in the input sequence. Tunable.
- Scope position
- A four-element vector of the form [left bottom width height] specifying the position of the scope window. (0,0) is the lower left corner of the display. Tunable.
- Title
- Title of signal trajectory plot. Tunable.
The following demos in the Communcations Blockset illustrate how to use the Discrete-Time Signal Trajectory Scope:
- Filtered Offset QPSK vs. Filtered QPSK -
foqpskvsfqpsk.mdl
- GMSK vs. MSK -
gmskvsmsk.mdl
See Also
Continuous-Time Eye and Scatter Diagrams, Discrete-Time Eye Diagram Scope, Discrete-Time Scatter Plot Scope
 | Discrete-Time Scatter Plot Scope | | Discrete-Time VCO |  |


