| Communications Blockset |
  |
Continuous-Time Eye and Scatter Diagrams
Produce eye diagram, scatter, or x-y plots, using trigger to set decision timing
Library
Comm Sinks
Description

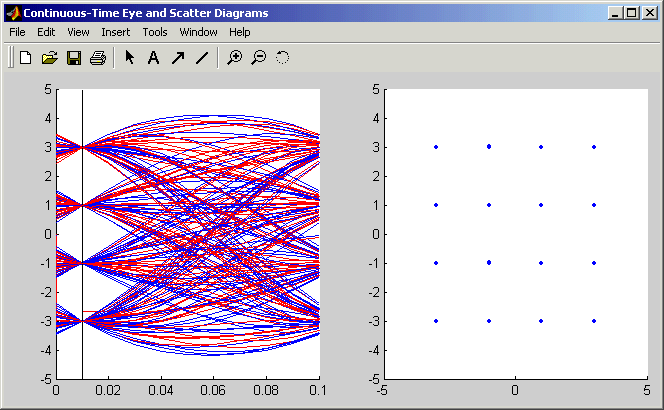
The Continuous-Time Eye and Scatter Diagrams block plots eye diagrams, scatter diagrams, and X-Y diagrams from a continuous-time input signal. The Diagram type parameter determines which plots the block produces. The block draws the diagrams in a single window, as in the case of the eye diagram and scatter diagram below.

The first input is a complex message signal. It must be a sample-based scalar signal. The eye diagram and the X-Y diagram both record the trajectories of the message signal in continuous time.
The second input is a scalar trigger signal that determines the decision timing for the scatter diagram. At each rising edge of the trigger signal, the block plots a vertical line in the eye diagram and adds a new point to the scatter plot.
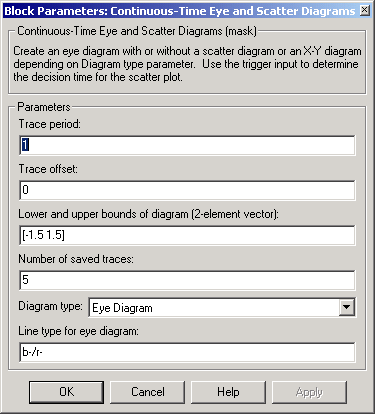
The Trace period parameter is the number of seconds represented by the horizontal axis in the eye diagram. The Trace offset parameter is the time value at the left edge of the horizontal axis of the eye diagram.
| Tip
This block works better if the model's simulation step size is suitable for your data. From the model window's Simulation menu, choose Simulation parameters and then choose a value for the Max step size parameter. Try multiplying this block's Trace period parameter by 1/8 or 1/16.
|
To specify the plotting color as well as the line type and/or marker type, use the Line type parameters that appear after you select a value for the Diagram type parameter. In the Line type for eye diagram parameter, use a slash (/) to separate the specifications for the real and imaginary components of the input signal. Choices for the color, marker, and line types are in the table below.
Color Characters
| Marker-Type Characters
| Line-Type Characters
|
y
|
Yellow
|
.
|
Point
|
-
|
Solid
|
m
|
Magenta
|
o
|
Circle
|
:
|
Dotted
|
c
|
Cyan
|
x
|
Cross
|
-.
|
Dash-dot
|
r
|
Red
|
+
|
Plus sign
|
--
|
Dashed
|
g
|
Green
|
*
|
Asterisk
|
|
|
b
|
Blue
|
s
|
Square
|
|
|
w
|
White
|
d
|
Diamond
|
|
|
k
|
Black
|
v
|
Triangle (down)
|
|
|
|
|
^
|
Triangle (up)
|
|
|
|
|
<
|
Triangle (left)
|
|
|
|
|
>
|
Triangle (right)
|
|
|
|
|
p
|
Five-pointed star
|
|
|
|
|
h
|
Six-pointed star
|
|
|
Dialog Box

- Trace period
- The duration of the horizontal axis of the eye diagram, in seconds.
- Trace offset
- The time at the leftmost edge of the horizontal axis of the eye diagram.
- Lower and upper bounds of diagram
- A two-element vector containing the minimum and maximum signal values in the diagrams.
- Number of saved traces
- The number of curves in the eye diagram, or points in the scatter plot, that are visible after you resize or restore the figure window.
- Diagram type
- The diagram(s) that the block produces.
- Line type for eye diagram
- A string that specifies the color and the line type for the eye diagram. This field appears only when the Diagram type parameter is set to an option that includes an eye diagram.
- Line type for scatter diagram
- A string that specifies the color and the marker type for the scatter diagram. This field appears only when the Diagram type parameter is set to an option that includes an scatter diagram.
- Line type for X-Y diagram
- A string that specifies the color and the line type for the X-Y diagram. This field appears only when the Diagram type parameter is set to an option that includes an X-Y diagram.
See Also
Discrete-Time Eye Diagram Scope, Discrete-Time Scatter Plot Scope, Discrete-Time Signal Trajectory Scope
 | Complex Phase Shift | | Convolutional Deinterleaver |  |


