| Communications Blockset |
  |
Discrete-Time Eye Diagram Scope
Display multiple traces of a modulated signal
Library
Comm Sinks
Description

The Discrete Eye Diagram Scope block displays multiple traces of a modulated signal to produce an eye diagram. You can use the block to reveal the modulation characteristics of the signal, such as pulse shaping or channel distortions.
The Discrete-Time Eye Diagram Scope block has one input port. The input signal can be either real or complex. The input signal must be a sample-based scalar in sample-based mode. The input must be a frame-based column vector or a scalar in frame-based mode.
Example: Viewing the Eye Diagram of a Modulated Signal
The following model creates an eye diagram for a modulated signal. The model modulates a random signal using the QPSK Modulator block and then filters the signal with a raised cosine interpolation filter.
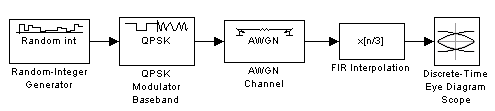
To build the model, gather and configure the following blocks:
- Random Integer Generator, in the Data Sources sublibrary of the Comm Sources library, with default parameters
- QPSK Modulator Baseband, in PM in the Digital Baseband sublibrary of the Modulation library of the Communications Blockset, with default parameters
- AWGN Channel, in the Channels library of the Communications Blockset, with the following changes to the default parameter settings:
- Set Mode to Signal-to-noise ratio (SNR).
- Set SNR (dB) to
15.
- FIR Interpolation, in the Multirate Filters sublibrary of the Filtering library of the DSP Blockset, with the following changes to the default parameter settings:
- Set FIR Filter Coefficients to
rcosine(1, 8,[], 0.5,3).
- Set Interpolation factor to
8.
- Discrete-Time Eye Diagram Scope, in the Comms Sinks library, with the following changes to the default parameter settings:
- Set Samples per symbol to
8.
- Set Symbols per trace to
3.
- Set Traces displayed to
3.
- Set New traces per display to
1.
- Check Show Rendering Properties and set Markers to
+ to indicate the points plotted at each sample. The default value of Markers is empty, which indicates no marker.
- Check Show Figure Properties and set Eye diagram to display to In-phase only.
When you run the model for 10 seconds, the Discrete-Time Eye Diagram Scope displays the following diagram.
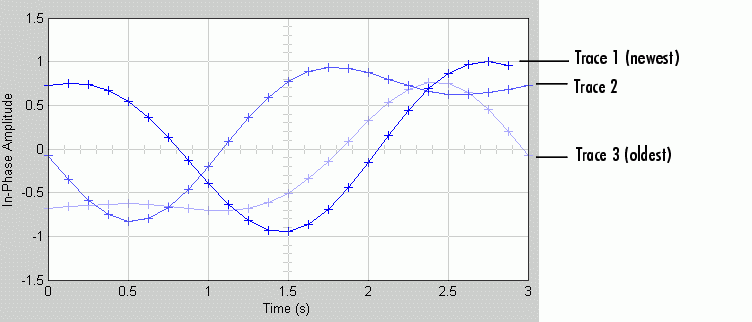
Note that three traces are displayed. Traces 2 and 3 are faded because the Show Rendering Properties and Color fading check boxes are selected. This causes traces to be displayed less brightly the older they are. In this picture, Trace 1 is the most recent and Trace 3 is the oldest. Because New traces per display is set to 1, only Trace 1 is appearing for the first time. Traces 2 and 3 also appear in the previous display.
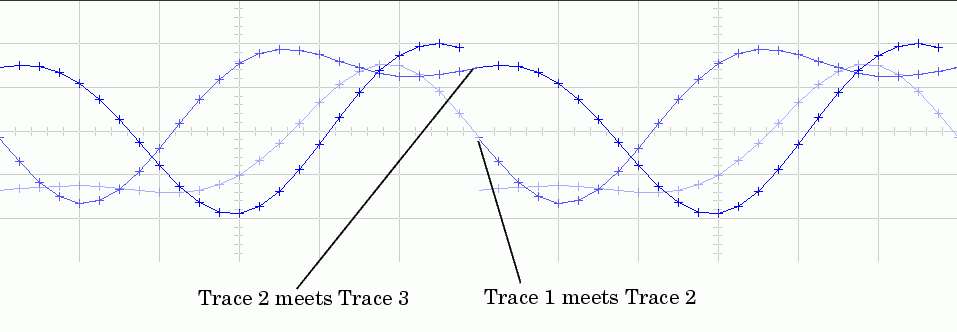
Because Symbols per trace is set to 3, each trace contains three symbols, and because Samples per trace is set to 8, each symbol contains eight samples. Note that trace 1 contains 24 points, which is the product of Symbols per trace and Samples per symbol. However, traces 2 and 3 contain 25 points each. The last point in trace 2, at the right border of the scope, represents the same sample as the first point in trace 1, at the left border of the scope. Similarly, the last point in trace 3 represents the same sample as the first point in trace 2. These duplicate points indicate where the traces would meet if they were displayed side by side, as illustrated in the following picture.
You can view a more realistic eye diagram by changing the value of Number of simultaneous traces to 40 and clearing the Line markers field.
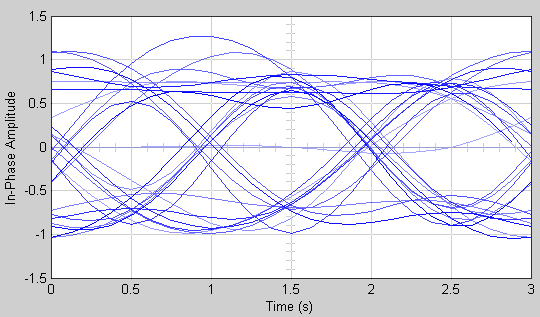
Note that when the Offset (samples) parameter is set to 0, the plotting starts at the center of the first symbol, so that the open part of the eye diagram is in the middle of the plot for most points.
For another example, see Example: Viewing a Sinusoid.
Marker and Line Styles
The Marker, Line style, and Line color parameters, which are visible when you check Show Rendering Properties, control the appearance of the signal trajectory. The Marker parameter specifies the marker style for points in the eye diagram. The following table lists some of the available line markers
Marker Style
|
Parameter Symbol
|
Appearance
|
Plus
|
+
|

|
Circle
|
o
|

|
Asterisk
|
*
|

|
Point
|
.
|

|
Cross
|
x
|

|
The Line style parameter specifies the style for lines in the eye diagram. The following lists some of the available line styles.
Line Style
|
Appearance
|
Solid
|

|
Dashed
|

|
Dotted
|

|
Dash-dot
|

|
The Line color parameter specifies the color of the eye diagram. These settings plot the signal channels in the following colors (8-bit RGB equivalents are shown in the center column).
Color
|
RGB Equivalent
|
Appearance
|
Black
|
(0,0,0)
|

|
Blue
|
(0,0,255)
|

|
Red
|
(255,0,0)
|

|
Green
|
(0,255,0)
|

|
Dark purple
|
(192,0,192)
|

|
See the line function in the MATLAB documentation for more information about the available markers, colors, and line styles.
Recommended Settings
The following table summarizes the recommended parameter settings for the Discrete-Time Eye Diagram Scope.
Parameter
|
Recommended Setting
|
Samples per symbol
|
Same as the Samples per symbol setting in the modulator block, or the Interpolation factor setting in the interpolation block
|
Offset (samples)
|
0 to view the open part of the eye
(Samples per symbol)/2 to view the closed part of the eye
|
Symbols per trace
|
An integer between 1 and 4
|
Traces displayed
|
10 times the alphabet size of the modulator, M
|
New traces per display
|
Same as Traces displayed for greater speed
A small positive integer for best animation
|
Marker
|
None or a point (.) to see where the samples are plotted
|
Line style
|
Solid dash (-)
|
Line color
|
Blue (b)
|
Duplicate points at trace boundary
|
Check Duplicate points at trace boundary for modulations such as PSK and QAM.
Clear to display the phase trees for MSK, CPFSK, GFSK, GMSK, and other continuous phase modulations.
|
Color fading
|
Check Color fading for animation that resembles an oscilloscope.
Clear for greater speed and animation that resembles a plot.
|
High quality rendering
|
Check High quality rendering for better animation.
Clear for greater speed.
|
Eye diagram to display
|
Select In-phase and Quadrature to view real and imaginary components.
Select In-phase Only to view real component only and for greater speed.
When the input is real and you choose In-phase and Quadrature, the quadrature component of the eye diagram is zero.
|
Open at start of simulation
|
Check Open at start of simulation to view the signal at the start of simulation.
Clear to view the signal after convergence to steady state and for greater initial speed.
|
Y-axis minimum
|
Approximately 10% less than the expected minimum value of the signal
|
Y-axis maximum
|
Approximately 10% greater than the expected maximum value of the signal
|
Scope Options
The scope title (in the window title bar) is the same as the block title. You can set the axis scaling by selecting Show Axes properties and setting the y-axis minimum and y-axis maximum parameters.
In addition to the standard MATLAB figure window menus (File, Edit, Window, Help), the Vector Scope window has an Axes and a Channels menu.
The properties listed in the Axes menu apply to all channels. Many of the parameters in this menu are also accessible through the block parameter dialog box. These are Autoscale, Show grid, Frame #, and Save Position. Below are descriptions of the other parameters listed in the Axes menu:
- Autoscale resizes the y-axis to best fit the vertical range of the data. The numerical limits selected by the autoscale feature are displayed in the Minimum Y-limit and Maximum Y-limit parameters in the parameter dialog box. You can change them by editing those values.
- Show grid - When selected, the scope displays a grid according to tick marks on the x- and y-axes.
- Frame # - When selected, the scope displays the current frame number at the bottom of the scope window.
- Save Position automatically updates the Scope position parameter in the Figure/Axes properties field to reflect the scope window's current position and size. To make the scope window open at a particular location on the screen when the simulation runs, simply drag the window to the desired location, resize it as needed, and select Save Position.
The properties listed in the Channels menu apply to a particular channel. The parameters listed in this menu are Style, Marker, and Color. They correspond to the parameters Line style, Marker, and Line color, respectively.
You can also access many of these options by right-clicking with the mouse anywhere on the scope display. The menu that pops up contains a combination of the options available in both the Axes and Channels menus.
Dialog Box
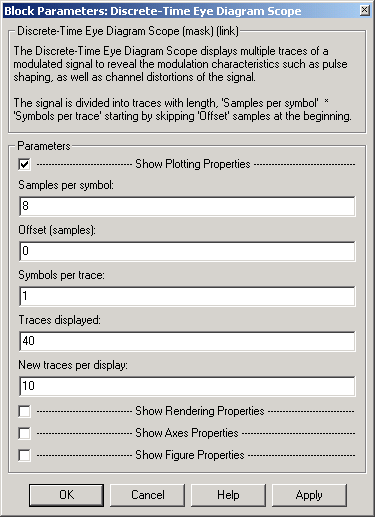
- Show Plotting Properties
- Select to display plotting properties.
- Samples per symbol
- Number of samples per symbol. Use with Symbols per trace to determine the number of samples per trace.
- Offset (samples)
- Nonnegative integer less than the value of Symbols per trace, specifying the number of samples to omit before plotting the first point. Tunable.
- Symbols per trace
- Positive integer specifying the number of symbols plotted per trace.
- Traces displayed
- Number of traces plotted.
- New traces per display
- Positive integer less than Traces displayed, specifying the number of new traces that appear in each display.
- Show Rendering Properties
- Select to display rendering properties, as shown in the following figure.
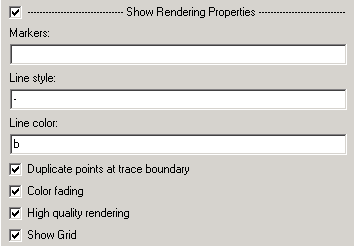
- Markers
- The marker for points in the eye diagram. Tunable.
- Line style
- The line style in the eye diagram. Tunable.
- Line color
- The line color in the eye diagram. Tunable.
- Duplicate points at trace boundary
- Check to enable duplicate points at the trace boundary. Clear to disable.
- Color fading
- When selected, the points in the eye diagram fade as the interval of time after they are first plotted increases. Tunable.
- High quality rendering
- When selected, the block renders a slow, higher-quality picture with overwrite raster operations. When cleared, the block renders a fast, lower-quality picture with XOR raster operations. Tunable.
- Show grid
- Toggles the scope grid on and off. Tunable.
- Show Axes Properties
- Select to display axes properties, as shown in the following figure.
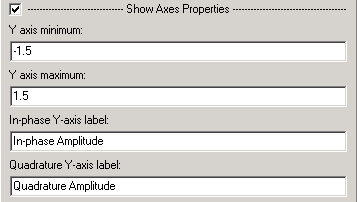
- Y-axis minimum
- Minimum signal value the scope displays. Tunable.
- Y-axis maximum
- Maximum signal value the scope displays. Tunable.
- In-phase Y-axis label
- Label for y-axis of the in-phase diagram. Tunable.
- Quadrature Y-axis label
- Label for y-axis of the quadrature diagram. Tunable.
- Show Figure Properties
- Select to display figure properties, as shown in the following figure.
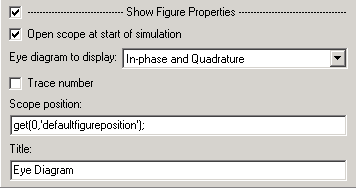
- Open scope at start of simulation
- When selected, the scope opens at the start of simulation. When cleared, you must double-click the block after the start of simulation to open the scope. Tunable.
- Eye diagram to display
- Type of eye diagram to display. Choose In-phase and Quadrature to display real and complex components, or In-phase Only to display only the real component. Tunable.
- Trace number
- Displays the number of the current trace in the input sequenced. Tunable.
- Scope position
- A four-element vector of the form [left bottom width height] specifying the position of the scope window. (0,0) is the lower left corner of the display. Tunable.
- Title
- Title of eye diagram figure window. Tunable.
The following Communications Blockset demos illustrate how to use the Discrete-Time Eye Diagram Scope block:
- CPM Phase Tree Example -
cpmphasetree.mdl
- Filtered Offset QPSK vs. Filtered QPSK -
foqpskvsfqpsk.mdl
- Rayleigh Fading Channel -
rayleighfading.mdl
- QPSK vs. MSK -
qpskvsmsk.mdl
See Also
Continuous-Time Eye and Scatter Diagrams, Discrete-Time Scatter Plot Scope, Discrete-Time Signal Trajectory Scope
| | Discrete Modulo Integrator | | Discrete-Time Scatter Plot Scope | |