| Communications Blockset | |
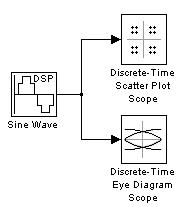
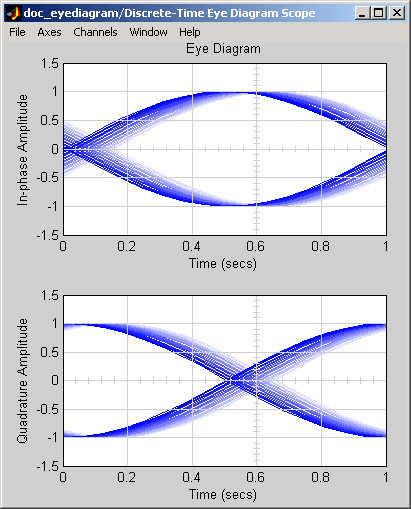
The following model produces a scatter plot and an eye diagram from a complex sinusoidal signal. Because the decision time interval is almost, but not exactly, an integer multiple of the period of the sinusoid, the eye diagram exhibits drift over time. More specifically, successive traces in the eye diagram and successive points in the scatter diagram are near each other but do not overlap.
To open the completed model, click here in the MATLAB Help browser. To build the model, gather and configure these blocks:
.502.
1/16.
16.
figposition([2.5 55 35 35]);.
Scatter Plot.
16.
figposition([42.5 55 35 35]);.
Eye Diagram.
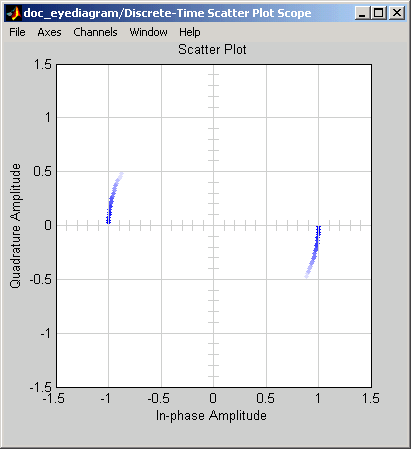
Connect the blocks as shown in the preceding figure. Also, from the model window's Simulation menu, choose Simulation parameters; then in the Simulation Parameters dialog box, set Stop time to 250. Running the model produces the following scatter diagram plot.
The points of the scatter plot lie on a circle of radius 1. Note that the points fade as time passes. This is because the box next to Color fading is checked in the Rendering Properties, which causes the scope to render points more dimly the more time that passes after they are plotted. If you clear this box, you see a full circle of points.
If you add the Discrete-Time Signal Trajectory Scope block to the model, it displays a circular trajectory.
In the eye diagram, the upper set of traces represents the real part of the signal and the lower set of traces represents the imaginary part of the signal.
| | Scopes | Source Coding | |