| Symbolic Math Toolbox | |
Syntax
ezplot(f)
ezplot(f,[min,max])
ezplot(f,[xmin,xmax,ymin,ymax])
ezplot(x,y)
ezplot(x,y,[tmin,tmax])
ezplot(...,figure)
Description
ezplot(f) plots the expression f = f(x) over the default domain  .
.
ezplot(f,[xmin xmax]) plots f = f(x) over the specified domain. It opens and displays the result in a window labeled Figure No. 1. If any plot windows are already open, ezplot displays the result in the highest numbered window.
ezplot(f,[xmin xmax],fign) opens (if necessary) and displays the plot in the window labeled fign.
For implicitly defined functions, f = f(x,y).
ezplot(f) plots f(x,y) = 0 over the default domain  ,
,  .
.
ezplot(f,[xmin,xmax,ymin,ymax]) plots f(x,y) = 0 over xmin < x < xmax and ymin < y < ymax.
ezplot(f,[min,max])plots f(x,y) = 0 over min < x < max and min < y < max.
If f is a function of the variables u and v (rather than x and y), then the domain endpoints umin, umax, vmin, and vmax are sorted alphabetically. Thus, ezplot(u^2 - v^2 - 1,[-3,2,-2,3]) plots u2 - v2 - 1 = 0 over -3 < u < 2,
-2 < v < 3.
ezplot(x,y) plots the parametrically defined planar curve x = x(t) and y = y(t) over the default domain  .
.
ezplot(x,y,[tmin,tmax]) plots x = x(t) and y = y(t) over tmin < t < tmax.
ezplot(...,figure) plots the given function over the specified domain in the figure window identified by the handle figure.
Algorithm
If you do not specify a plot range, ezplot samples the function between -2*pi and 2*pi and selects a subinterval where the variation is significant as the plot domain. For the range, ezplot omits extreme values associated with singularities.
Examples
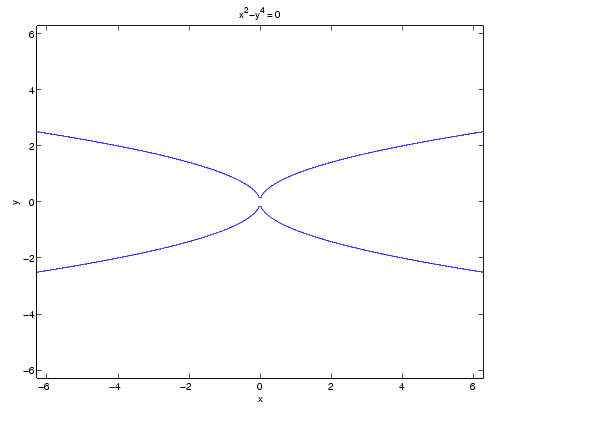
This example plots the implicitly defined function,
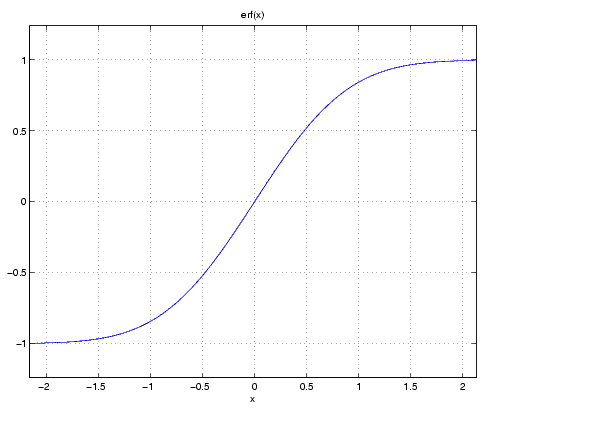
plot a graph of the error function.
See Also
ezcontour, ezcontourf, ezmesh, ezmeshc, ezplot3, ezpolar, ezsurf, ezsurfc, plot
| | ezmeshc | ezplot3 | |