
| Robust Control Toolbox |   |
Discrete singular value frequency response.
Continuous singular value frequency response.
Syntax
[sv,w] = (d)sigma(a,b,c,d(,Ts))
[sv,w] = (d)sigma(a,b,c,d(,Ts),'inv')
[sv,w] = (d)sigma(a,b,c,d(,Ts),w)
[sv,w] = (d)sigma(a,b,c,d(,Ts),w,'inv')
[sv,w] = (d)sigma(ss,..)
Description
sigma computes the singular values of the complex matrix  as a function of frequency,
  . The singular values are an extension of the Bode magnitude response for MIMO systems. When invoked without lefthand arguments,
 sigma produces a singular value Bode plot on the screen. The frequency range is chosen automatically and incorporates more points where the plot is changing rapidly.
For square systems, sigma(A, B, C, D,' inv') plots the singular values of the inverse complex matrix:

When supplied by the user, the vector w specifies the frequencies in radians/sec at which the singular value Bode plot will be calculated. See logspace to generate frequency vectors that are equally spaced logarithmically in frequency.
When invoked with lefthand arguments,
returns the magnitude of the singular values in matrixsv and the frequency points in w. No plot is drawn on the screen. Each column of the matrix sv contains the singular values, in decreasing order, for the corresponding frequency point in the vector w.
Dsigma computes the discrete version of the singular value Bode plot by substituting  for G(j
 ). The variable
 Ts is the sampling period.
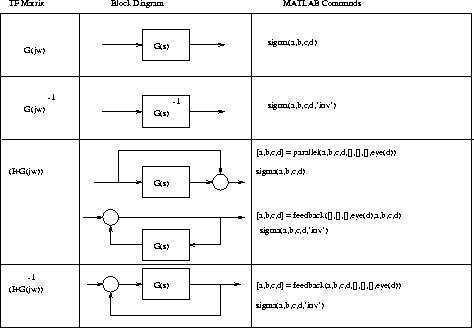
For robustness analysis, the singular values of particular transfer matrices are analyzed. The table below shows which input-output combinations and associated MATLAB commands achieve the desired transfer matrices:

The singular value response of a SISO system is identical to the Bode magnitude response of that system.
Examples
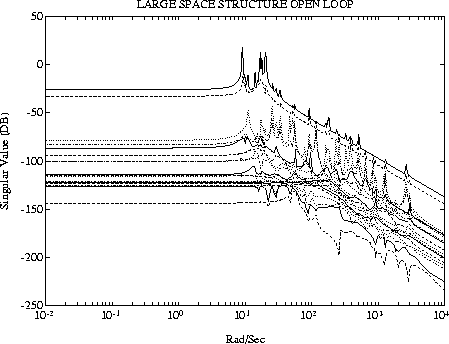
Figure 1-5 shows the singular value Bode plot of the open loop large space structure in [1]. There are 58 vibrational modes (116 states) with damping ratio 0.3 to 0.002 scattered in the frequency range from 0.4 Hz to 477 Hz, 18 control actuators and 20 sensors.

Figure 1-5: Singular Value Bode Plot of LSS.
Algorithm
Sigma and dsigma use the svd function in MATLAB.
See Also
bode, cgloci, dcgloci, dbode, logspace
References
[1] M. G. Safonov, R. Y. Chiang and H. Flashner, "H Control Synthesis for a Large Space Structure," AIAA J. Guidance, Control and Dynamics, 14, 3, pp. 513-520, May/June 1991.
 | driccond | fitd |  |