| CAGE User's Guide |
  |
Using Color to Display Information
You can use the plot view to display more information by coloring the plots.
Coloring a Plot
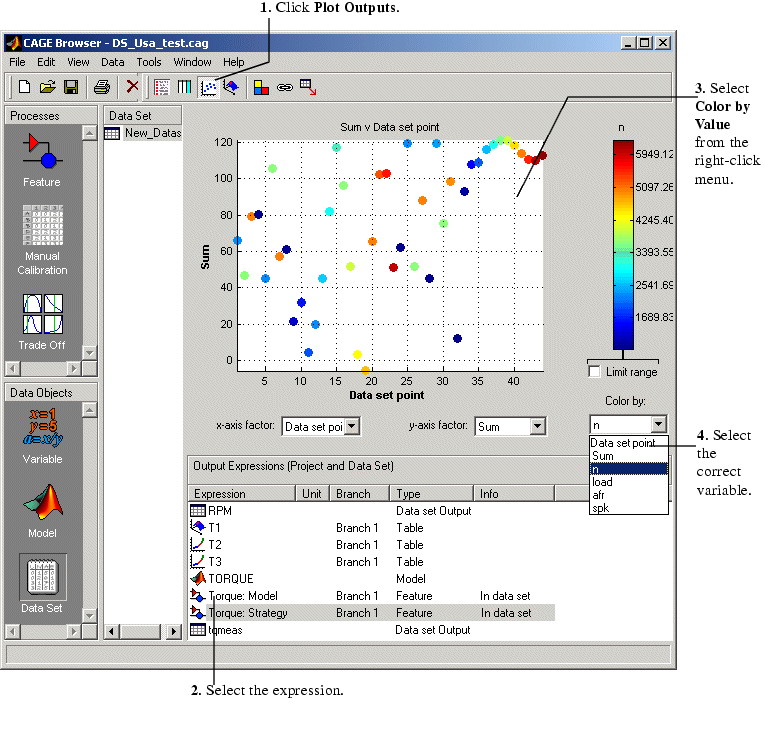
- Select View -> Plot or click
 .
.
- Highlight the correct expression in the Output Expressions (Project and Data Set) pane.
- Select Color by Value from the right-click menu of the plot.
- Select from the pop-up menu the variable you want to use to color the plot.

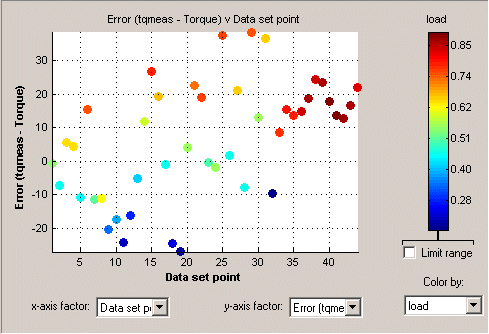
In the following figure, you can see
- A plot of the
Sum vs Data Set Point (this is the strategy from a torque feature calibration).
- The points are colored by load.
- For this example it can be seen that in general, the higher the load, the higher the value of torque.

 | Plotting Outputs | | Restricting the Color |  |


 .
.

