| CAGE User's Guide |
  |
Plotting Outputs
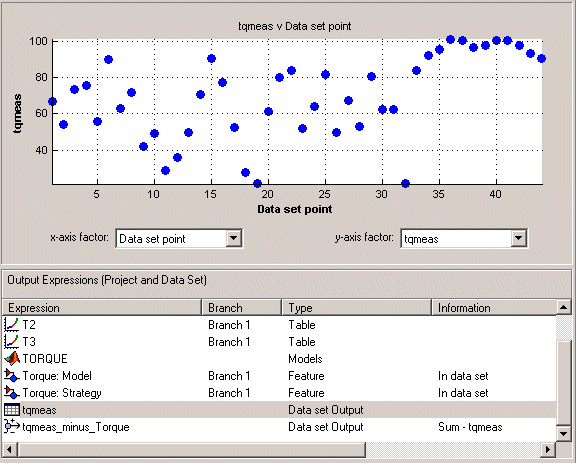
Use this to plot the outputs of your data sets.
To view a plot:
- Select View -> Plot or click the
 toolbar button.
- Select an expression from the list to view.
- A plot of the selected output factor appears in the top pane.

- Use the pop-up menus below the plot to change the factors displayed.
To zoom in on an area of interest:
- Press both mouse buttons simultaneously and drag a rectangle; double-click the graph to return to full size.
Plotting Multiple Selections
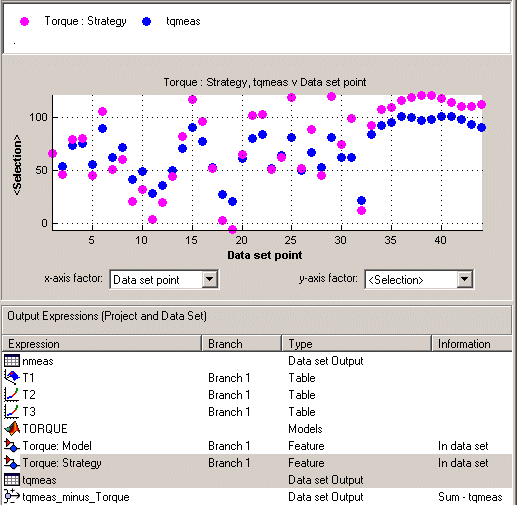
You can plot a multiple selection by using standard Ctrl+click and Shift+click operations.
A legend at the top of the screen displays the key to the graph.

Multiple Plot Outputs
When exactly two items are displayed, further plot options are available:
- Plot the first item against the second item (X-Y Selection).
- Display the error using one of the following options:
- Error
- Absolute error
- Relative error (%)
- Absolute relative error (%)
 | Viewing Data in a Table | | Using Color to Display Information |  |


