| Database Toolbox |
  |
Display Chart, Charting Dialog Box
After executing a query, to see query results presented as a chart, such as a pie or bar chart, select Chart from the Display menu.
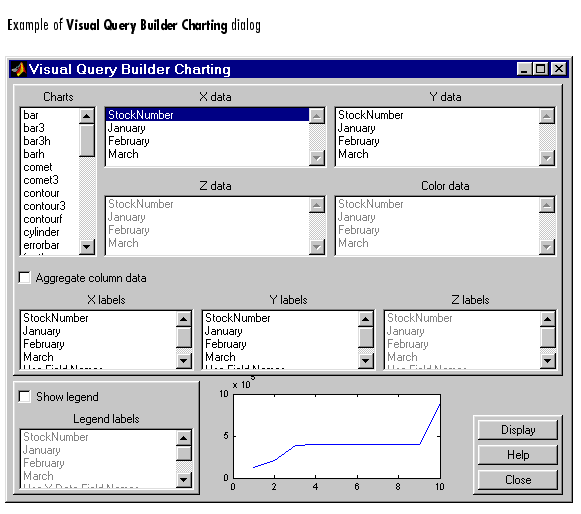
The Visual Query Builder Charting dialog box appears.

Make selections in the Visual Query Builder Charting dialog box to create the chart.
- Select the type of chart you want to display from the Charts listbox.
- Select the data you want to display in the chart from the X Data, Y Data, Z Data, and Color Data listboxes.
- Check Aggregate Column Data if you want to display counts rather than values.
- Select the X Labels, Y Labels, and Z Labels for the chart.
- To display a legend, check the Show Legend checkbox.
- A preview of the chart appears at the bottom of the dialog box--see Preview the Chart.
- When the preview of the chart looks the way you want the chart to look, Display the Chart by clicking Display.
- Click Close to close the Charting dialog box and return to the Visual Query Builder dialog box.
See Also
 | Display Data | | Charts |  |


