
| Database Toolbox |   |
Display Data
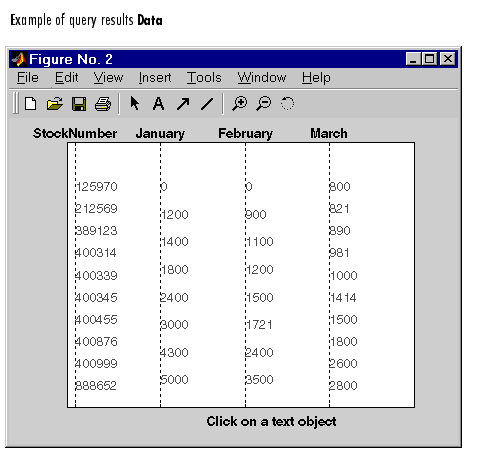
After executing a query, select Data from the Display menu to see a relational view of the data. The query results appear in a figure window.

Using the Data Display
StockNumber field, 8 entries in the January and February fields, and 10 entries in the March field, corresponding to the number of unique values in those fields. Therefore, do not read each row of the table as a single record.
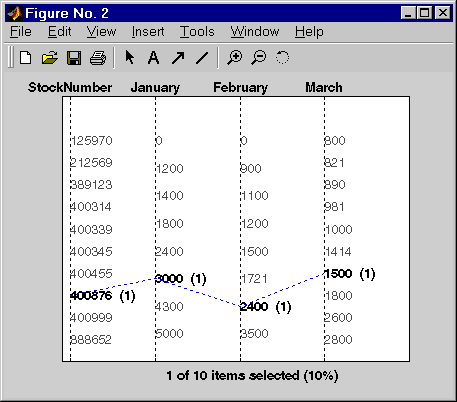
StockNumber 400876, to see the associated values. The data associated with the selected value is shown via a dotted line. For this example, sales for item 400876 are 3000 in January, 2400 in February, and 1500 in March.
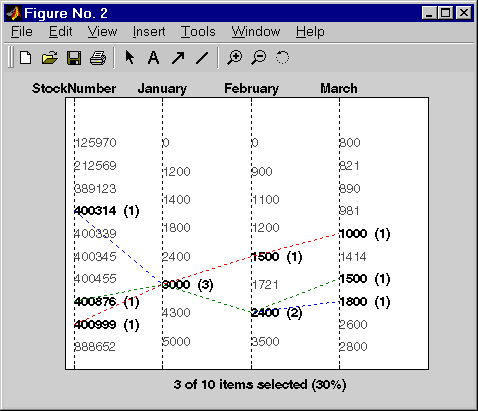
3000 in the January field. There are three different items with sales of 3000 units in January, 400314, 400876, and 400999.
 . Use the figure window's Help menu for instructions.
See Also
 | Display Menu | Display Chart, Charting Dialog Box |  |