
| Database Toolbox |   |
Aggregate Column Data
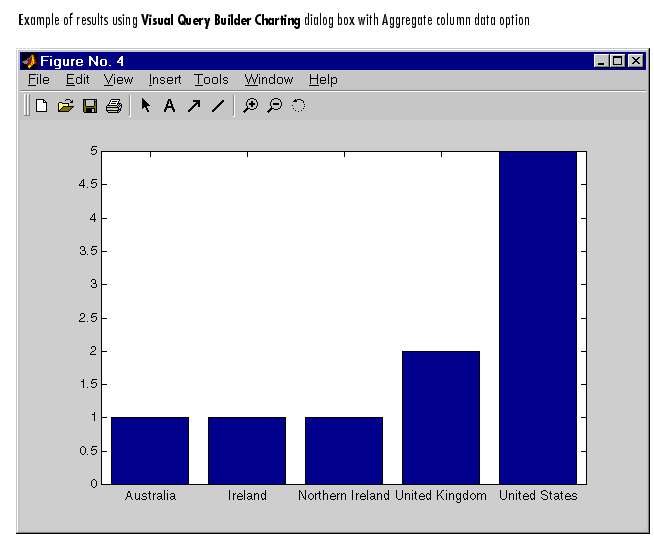
This example shows a bar chart of suppliers' countries with Aggregate column data checked. From the chart you can see that Australia, Ireland, and Northern Ireland each have one supplier, the United Kingdom has two suppliers, and the United States has five suppliers.

 | X Data, Y Data, Z Data, and Color Data | X Labels, Y Labels, and Z Labels |  |