| Curve Fitting Toolbox |
  |
Smoothing Data
If your data is noisy, you might need to apply a smoothing algorithm to expose its features, and to provide a reasonable starting approach for parametric fitting. The two basic assumptions that underlie smoothing are
- The relationship between the response data and the predictor data is smooth.
- The smoothing process results in a smoothed value that is a better estimate of the original value because the noise has been reduced.
- The smoothing process attempts to estimate the average of the distribution of each response value. The estimation is based on a specified number of neighboring response values.
You can think of smoothing as a local fit because a new response value is created for each original response value. Therefore, smoothing is similar to some of the nonparametric fit types supported by the toolbox, such as smoothing spline and cubic interpolation. However, this type of fitting is not the same as parametric fitting, which results in a global parameterization of the data.
| Note
You should not fit data with a parametric model after smoothing, because the act of smoothing invalidates the assumption that the errors are normally distributed. Instead, you should consider smoothing to be a data exploration technique.
|
There are two common types of smoothing methods: filtering (averaging) and local regression. Each smoothing method requires a span. The span defines a window of neighboring points to include in the smoothing calculation for each data point. This window moves across the data set as the smoothed response value is calculated for each predictor value. A large span increases the smoothness but decreases the resolution of the smoothed data set, while a small span decreases the smoothness but increases the resolution of the smoothed data set. The optimal span value depends on your data set and the smoothing method, and usually requires some experimentation to find.
The Curve Fitting Toolbox supports these smoothing methods:
- Moving average filtering -- Lowpass filter that takes the average of neighboring data points.
- Lowess and loess -- Locally weighted scatter plot smooth. These methods use linear least squares fitting, and a first-degree polynomial (lowess) or a second-degree polynomial (loess). Robust lowess and loess methods that are resistant to outliers are also available.
- Savitzky-Golay filtering -- A generalized moving average where you derive the filter coefficients by performing an unweighted linear least squares fit using a polynomial of the specified degree.
Note that you can also smooth data using a smoothing spline. Refer to Nonparametric Fitting for more information.
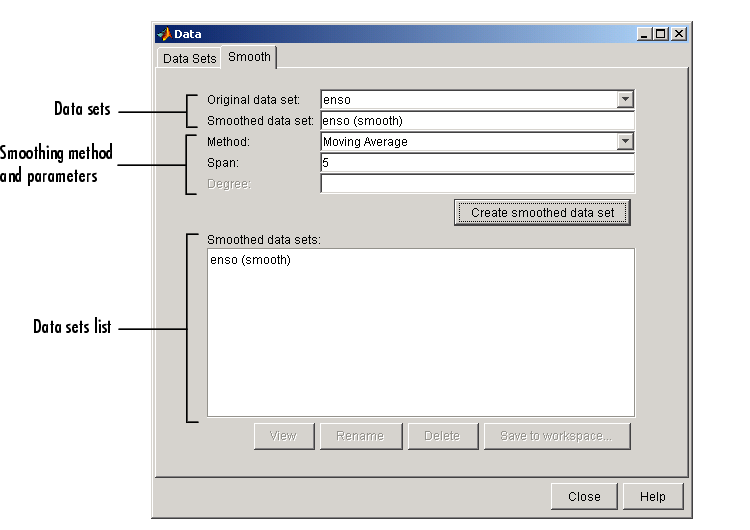
You smooth data with the Smooth pane of the Data GUI. The pane is shown below followed by a description of its features.

Data Sets
- Original data set -- Select the data set you want to smooth.
- Smoothed data set -- Specify the name of the smoothed data set. Note that the process of smoothing the original data set always produces a new data set containing smoothed response values.
Smoothing Method and Parameters
- Method -- Select the smoothing method. Each response value is replaced with a smoothed value that is calculated by the specified smoothing method.
- Moving average -- Filter the data by calculating an average.
- Lowess -- Locally weighted scatter plot smooth using linear least squares fitting and a first-degree polynomial.
- Loess -- Locally weighted scatter plot smooth using linear least squares fitting and a second-degree polynomial.
- Savitzky-Golay -- Filter the data with an unweighted linear least squares fit using a polynomial of the specified degree.
- Robust Lowess -- Lowess method that is resistant to outliers.
- Robust Loess -- Loess method that is resistant to outliers.
- Span -- The number of data points used to compute each smoothed value.
- For the moving average and Savitzky-Golay methods, the span must be odd. For all locally weighted smoothing methods, if the span is less than 1, it is interpreted as the percentage of the total number of data points.
- Degree -- The degree of the polynomial used in the Savitzky-Golay method. The degree must be smaller than the span.
Data Sets List
- Smoothed data sets -- Lists all the smoothed data sets. You add a smoothed data set to the list by clicking the Create smoothed data set button. When you select a data set from the list, you can perform these actions:
- Click View to open the View Data Set GUI. Using this GUI, you can view a single data set both graphically and numerically. Additionally, you can display data points to be excluded in a fit by selecting an exclusion rule.
- Click Rename to change the name of a single data set.
- Click Delete to delete one or more data sets. To select multiple data sets, you can use the Ctrl key and the mouse to select data sets one by one, or you can use the Shift key and the mouse to select a range of data sets.
- Click Save to workspace to save a single data set to a structure.
 | Viewing Data | | Moving Average Filtering |  |


