

| Curve Fitting Toolbox | |
Additional Preprocessing Steps
Additional preprocessing steps not available through the Curve Fitting Toolbox GUIs include
Transforming the Response Data
In some circumstances, you might want to transform the response data. Common transformations include the logarithm ln(y), and power functions such as y1/2, y-1, and so on. Using these transformations, you can linearize a nonlinear model, contract response data that spans one or more orders of magnitude, or simplify a model so that it involves fewer coefficients.
For example, suppose you want to use the following model to fit your data.
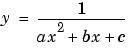
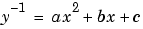
If you decide to use the power transform y-1, then the transformed model is given by
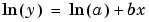
As another example, the equation

becomes linear if you take the log transform of both sides.
You can now use linear least squares fitting procedures.
There are several disadvantages associated with performing transformations:
Deciding on a particular transformation is not always obvious. However, a scatter plot will often reveal the best form to use. In practice you can experiment with various transforms and then plot the residuals from the command line using the transformed scale. If the errors are reasonable (they appear random with minimal scatter, and don't exhibit any systematic behavior), the transform is a good candidate.
| | Example: Sectioning Periodic Data | Removing Infs, NaNs, and Outliers | |