

| Curve Fitting Toolbox | |
Example: Excluding and Sectioning Data
This example modifies the ENSO data set to illustrate excluding and sectioning data. First, copy the ENSO response data to a new variable and add two outliers that are far removed from the bulk of the data.
rand('state',0)
yy = pressure;
yy(ceil(length(month)*rand(1))) = mean(pressure)*2.5;
yy(ceil(length(month)*rand(1))) = mean(pressure)*3.0;
Import the variables month and yy as the new data set enso1, and open the Exclude GUI.
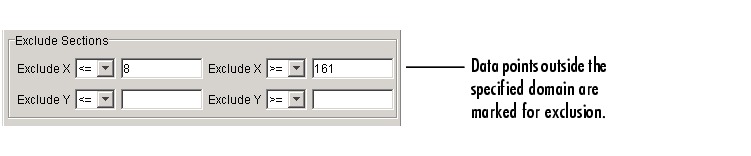
Assume that the first and last eight months of the data set are unreliable, and should be excluded from subsequent fits. The simplest way to exclude these data points is to section the predictor data. To do this, specify the range of data you want to include in the Exclude X outside of field of the Section pane.
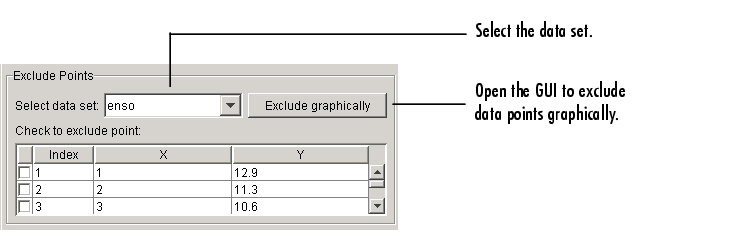
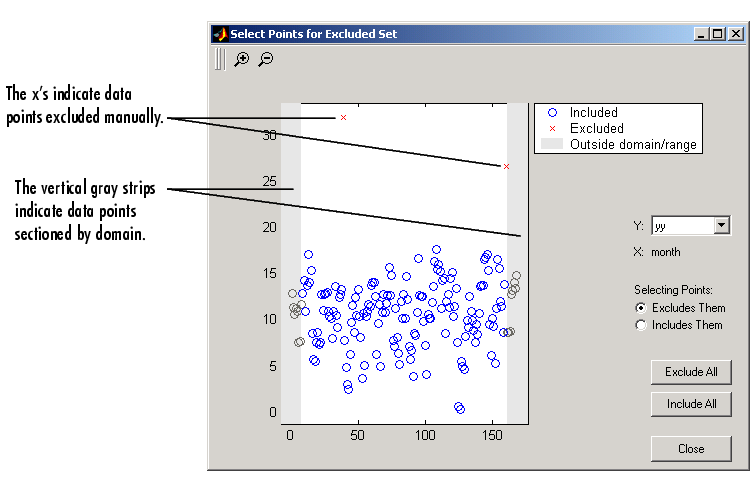
There are two ways to exclude individual data points: using the Check to exclude point table or graphically. For this example, the simplest way to exclude the outliers is graphically. To do this, select the data set name and click the Exclude graphically button, which opens the Select Points for Exclusion Rule GUI.
To mark data points for exclusion in the GUI, place the mouse cursor over the data point and left-click. The excluded data point is marked with a red X. To include an excluded data point, right-click the data point or select the Include Them radio button and left-click. Included data points are marked with a blue circle. To select multiple data points, click the left mouse button and drag the selection rubber band so that the rubber band box encompasses the desired data points. Note that the GUI identifies sectioned data with gray strips. You cannot graphically include sectioned data.
As shown below, the first and last eight months of data are excluded from the data set by sectioning, and the two outliers are excluded graphically. Note that the graphically excluded data points are identified in the Check to exclude point table. If you decide to include an excluded data point using the table, the graph is automatically updated.
If there are fits associated with the data, you can exclude data points based on the residuals of the fit by selecting the residual data in the Y list.
The Exclude GUI for this example is shown below.
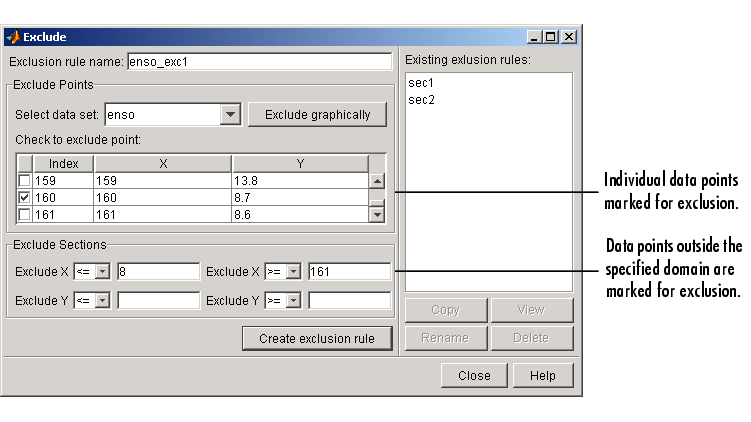
To save the exclusion rule, click the Create exclusion rule button. To exclude the data from a fit, you must select the exclusion rule from the Fitting GUI. Because the exclusion rule created in this example uses individually excluded data points, you can use it only with data sets that are the same size as the ENSO data set.
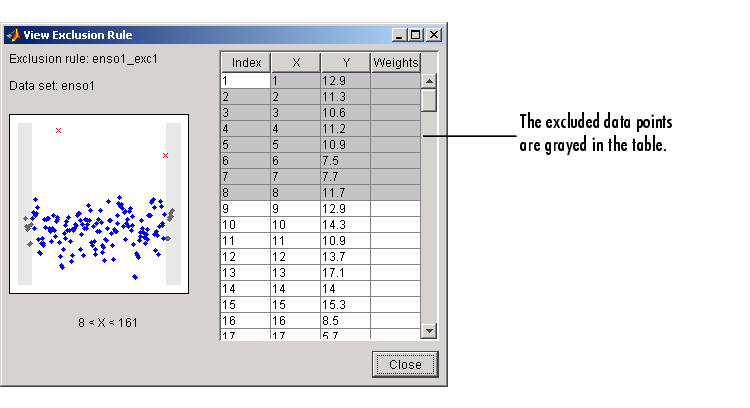
Viewing the Exclusion Rule
To view the exclusion rule, select an existing exclusion rule name and click the View button. The View Exclusion Rule GUI shown below displays the modified ENSO data set and the excluded data points, which are grayed in the table.
| | Sectioning | Example: Sectioning Periodic Data | |