

| Curve Fitting Toolbox |   |
Syntax
Arguments
xdata |
A vector of predictor data. |
ydata |
A vector of response data. |
Description
cftool
cftool(xdata,ydata)
xdata and response data specified by ydata. xdata and ydata must be vectors of the same size. Infs and NaNs are ignored because you cannot fit data containing these values. Additionally, only the real component of a complex value is used.
Remarks
The Curve Fitting Tool is a graphical user interface (GUI) that allows you to
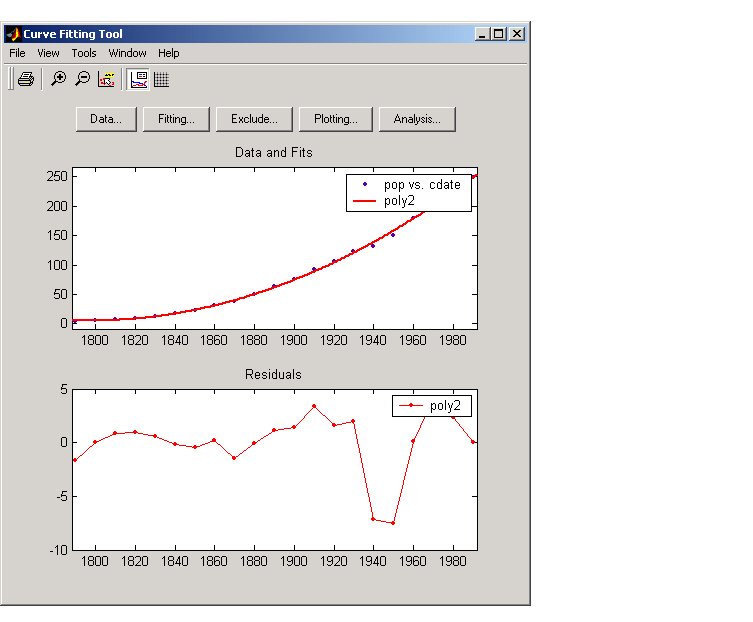
The Curve Fitting Tool is shown below. The data is from the census MAT-file, and the fit is a quadratic polynomial. The residuals are shown as a line plot below the data and fit
 .
.
The Curve Fitting Tool provides several features that facilitate data and fit exploration. Refer to Viewing Data for a description of these features.
By clicking the Data, Fitting, Exclude, Plotting, or Analysis buttons, you can open the associated GUIs, which are described below. For a complete example that uses many of these GUIs, refer to Getting Started with the Curve Fitting Toolbox.
The Data GUI
The Data GUI is shown below with the census data loaded.
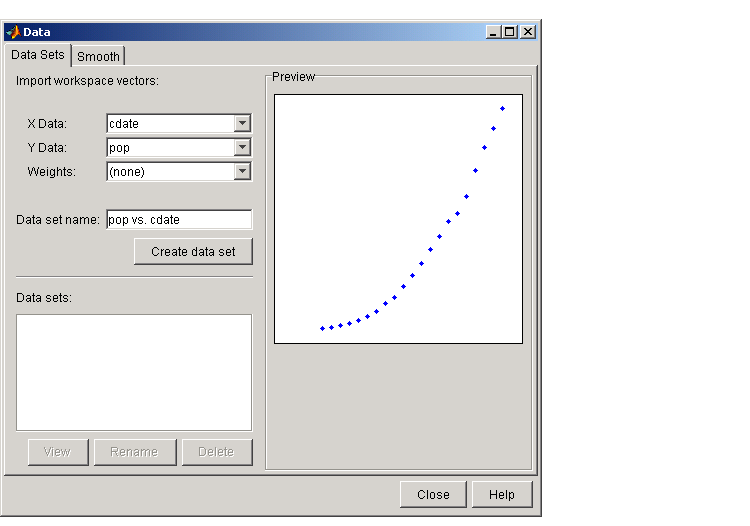
Refer to Importing, Viewing, and Preprocessing Data for more information about the Data GUI.
The Fitting GUI
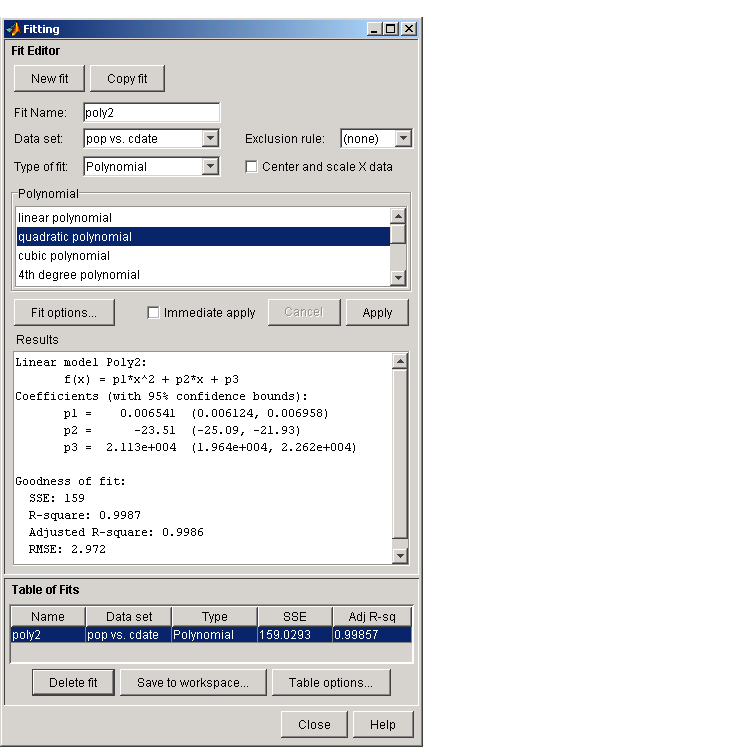
The Fitting GUI shown below displays the results of fitting the census data to a quadratic polynomial.
The Exclude GUI
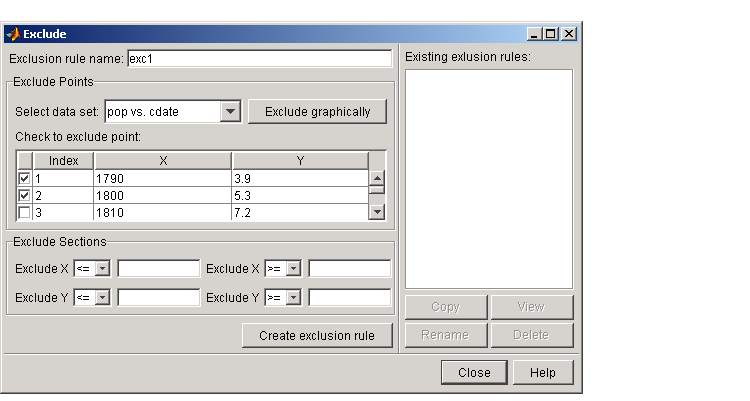
The Exclude GUI allows you to create exclusion rules for a data set. An exclusion rule identifies data to be excluded while fitting. The excluded data can be individual data points, or a section of predictor or response data. The Exclude GUI shown below indicates that the first two data points of the census data are marked for exclusion, and that this exclusion rule is named exc1.
The Plotting GUI
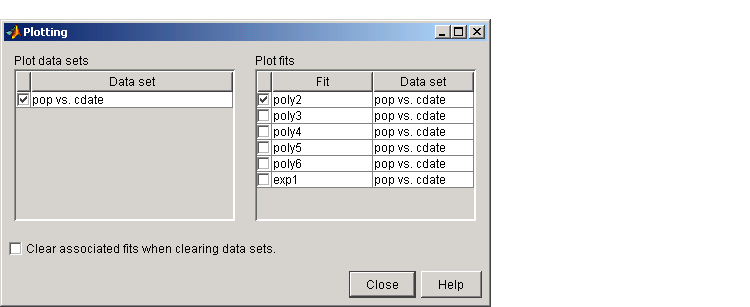
The Plotting GUI allows you to control the data sets and fits displayed by the Curve Fitting Tool. The Plotting GUI shown below indicates that the census data and the fit poly2 are displayed by the Curve Fitting Tool.
The Analysis GUI
The Analysis GUI allows you to
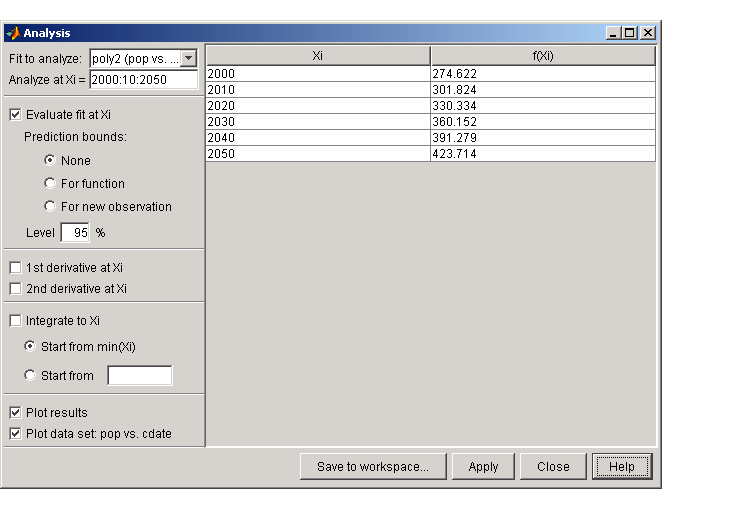
The Analysis GUI shown below displays the numerical results of extrapolating the census data from the year 2000 to the year 2050 in 10-year increments.
Refer to Analyzing the Fit for an example that uses the Analysis GUI.
 | cflibhelp | confint |  |