
| Curve Fitting Toolbox |   |
Analyzing the Fit
You can evaluate (interpolate or extrapolate), differentiate, or integrate a fit over a specified data range with the Analysis GUI. You open this GUI by clicking the Analysis button on the Curve Fitting Tool.
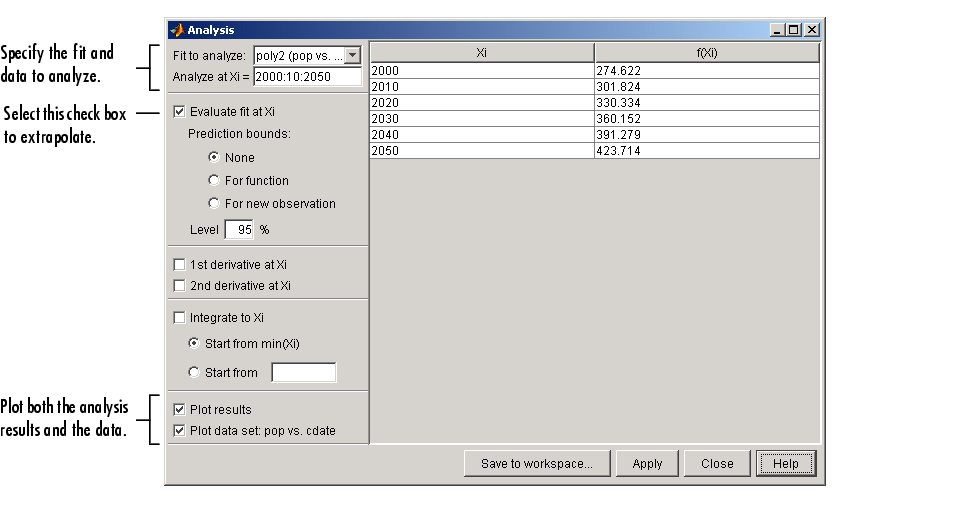
For this example, you will extrapolate the quadratic polynomial fit to predict the US population from the year 2000 to the year 2050 in 10 year increments, and then plot both the analysis results and the data. To do this:
The numerical extrapolation results are shown below.

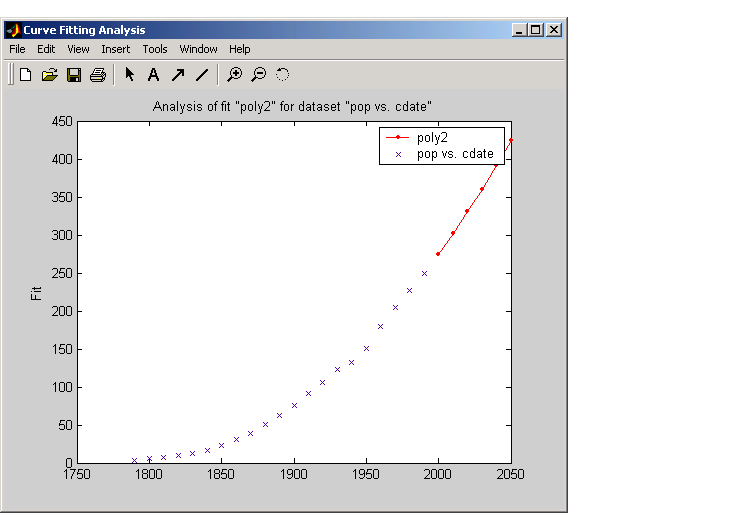
The extrapolated values and the census data set are displayed together in a new figure window.

Saving the Analysis Results
By clicking the Save to workspace button, you can save the extrapolated values as a structure to the MATLAB workspace.

The resulting structure is shown below.
 | Saving the Fit Results | Saving Your Work |  |