Example - Adding Annotations
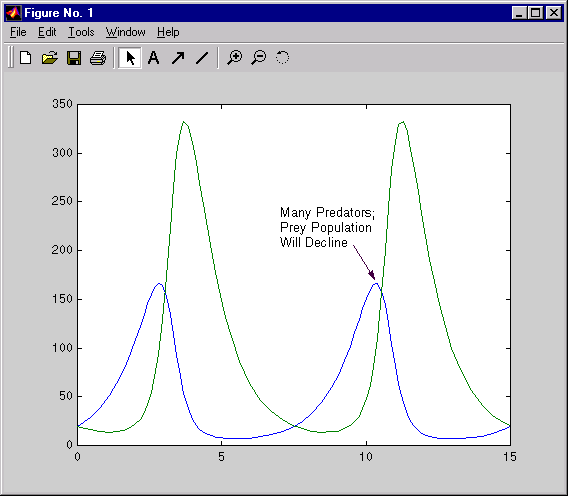
This example adds arrow and text annotations to the plot of the Lotka-Volterra model of predator/prey populations. The figure below shows how the plot looks after adding the annotations.

- 1
- Create the Lotka-Volterra plot using 0 to 15 years as the time frame and an
initial population size of 20 for both predators and prey.
[t,y]=ode23('lotka',[0 15],[20;20])
plot(t,y)
- 2
- Add a text annotation.
- Click the text annotation button in the Plot Editor toolbar.
- Move the cursor to the location where you want the text to appear and
click.
- Type the following, pressing the Enter or Return key to advance to new
lines.
Many Predators;
Prey Population
Will Decline
- Click outside of the text annotation area to see the text you just added.
- 3
- Add an arrow annotation.
- Click the arrow annotation button in the Plot Editor toolbar.
- Move the cursor to the location where you want the end of the arrow to
appear.
- Draw the arrow by dragging the cursor from the end of the arrow to the
tip of the arrow.
To move or change the annotations you just added, see instructions in Example - Changing Text, Arrows, and Lines.
[ Previous | Help Desk | Next ]
