| Symbolic Math Toolbox | |
Extended Calculus Example
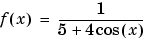
provides a starting point for illustrating several calculus operations in the toolbox. It is also an interesting function in its own right. The statements
store the symbolic expression defining the function in f.
The function ezplot(f) produces the plot of  as shown below.
The ezplot function tries to make reasonable choices for the range of the x-axis and for the resulting scale of the y-axis. Its choices can be overridden by an additional input argument, or by subsequent axis commands. The default domain for a function displayed by ezplot is  . To produce a graph of
  for
for  , type
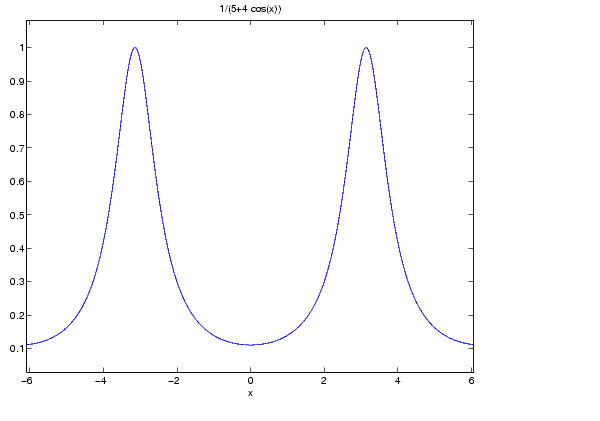
Let's now look at the second derivative of the function f:
Equivalently, we can type f2 = diff(f,x,2). The default scaling in ezplot cuts off part of f2's graph. Set the axes limits manually to see the entire function:
From the graph, it appears that the values of  lie between -4 and 1. As it turns out, this is not true. We can calculate the exact range for
 f (i.e., compute its actual maximum and minimum).
The actual maxima and minima of  occur at the zeros of
  . The statements
compute  and display it in a more readable format:
                3
           sin(x)            sin(x) cos(x)          sin(x)
   384 --------------- + 96 --------------- - 4 ---------------
                     4                    3                   2
       (5 + 4 cos(x))       (5 + 4 cos(x))      (5 + 4 cos(x))
We can simplify this expression using the statements
f3 = simple(f3);
pretty(f3)
                                 2                        2
                sin(x) (96 sin(x)  + 80 cos(x) + 80 cos(x)  - 25)
              4 -------------------------------------------------
                                               4
                                 (5 + 4 cos(x))
Now use the solve function to find the zeros of  .
.
returns a 5-by-1 symbolic matrix
z =[ 0][ atan((-255-60*19^(1/2))^(1/2),10+3*19^(1/2))][ atan(-(-255-60*19^(1/2))^(1/2),10+3*19^(1/2))][ atan((-255+60*19^(1/2))^(1/2)/(10-3*19^(1/2)))+pi][ -atan((-255+60*19^(1/2))^(1/2)/(10-3*19^(1/2)))-pi]
each of whose entries is a zero of  : The commands
convert the zeros to double form:
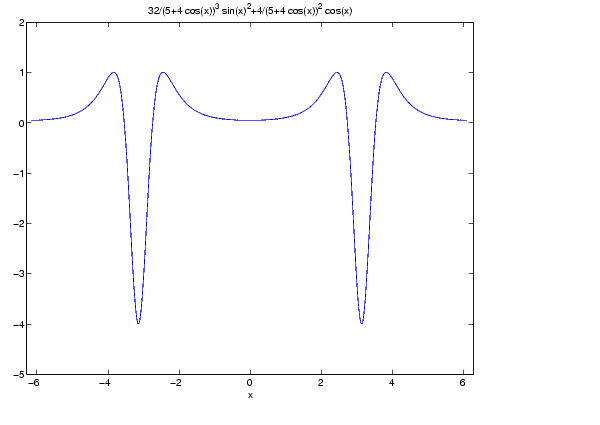
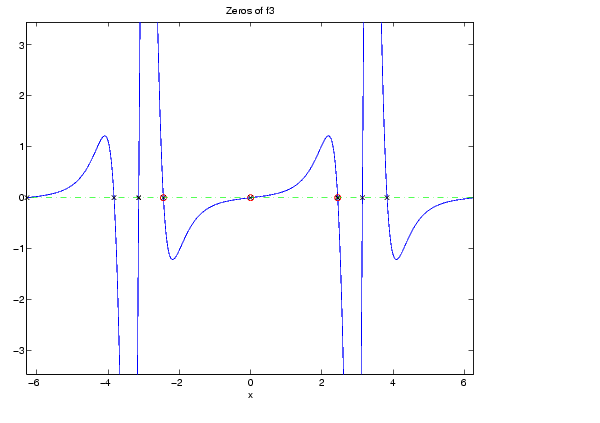
So far, we have found three real zeros and two complex zeros. However, a graph of f3 shows that we have not yet found all its zeros:
This occurs because  contains a factor of
  , which is zero at integer multiples of
  . The function,
 solve(sin(x)), however, only reports the zero at x = 0.
We can obtain a complete list of the real zeros by translating zr
Now let's plot the transformed zr on our graph for a complete picture of the zeros of f3:
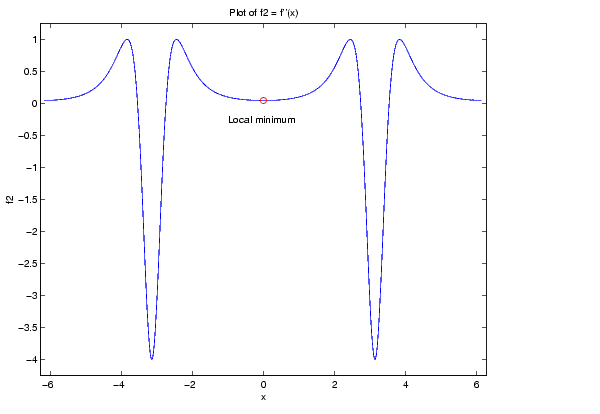
The first zero of  found by
 solve is at x = 0. We substitute 0 for the symbolic variable in f2
to compute the corresponding value of  :
:
A look at the graph of  shows that this is only a local minimum, which we demonstrate by replotting
 f2:
clf
ezplot(f2)
axis([-2*pi 2*pi -4.25 1.25])
ylabel('f2');
title('Plot of f2 = f''''(x)')
hold on
plot(0,double(f20),'ro')
text(-1,-0.25,'Local minimum')
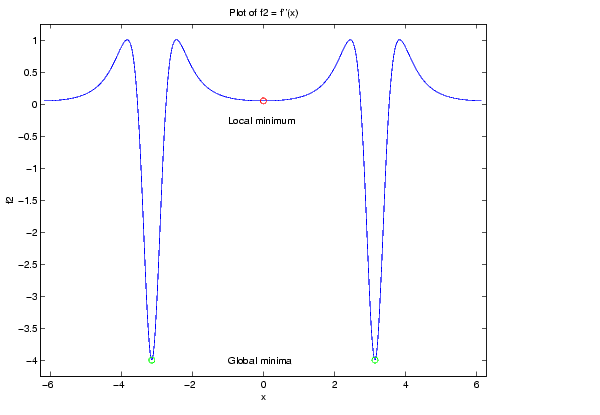
indicates that the global minima occur near  and
and  . We can demonstrate that they occur exactly at
  , using the following sequence of commands. First we try substituting
  and
and  into
into  :
:
shows that  and
and  happen to be critical points of
  . We can see that
  and
and  are global minima by plotting
 f2(-pi) and f2(pi) against f2(x).
m1 = double(subs(f2,x,-pi)); m2 = double(subs(f2,x,pi));
plot(-pi,m1,'go',pi,m2,'go')
text(-1,-4,'Global minima')
as shown in the following plot.
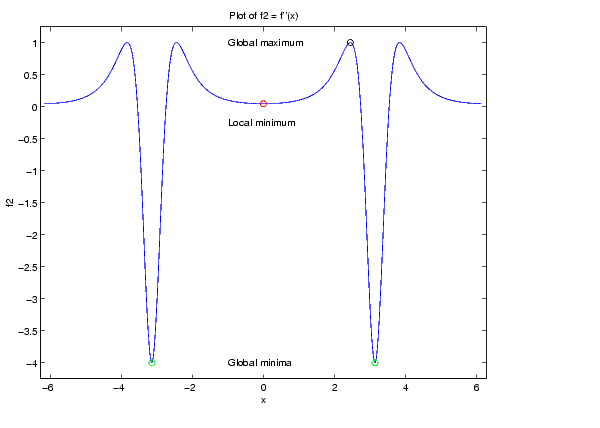
The foregoing analysis confirms part of our original guess that the range of  is
is [-4, 1]. We can confirm the other part by examining the fourth zero of  found by
 solve. First extract the fourth zero from z and assign it to a separate variable
displays the zero's corresponding numeric value:
Plotting the point (s, f2(s)) against f2, using
visually confirms that s is a maximum.
Therefore, our guess that the maximum of  is [-4, 1] was close, but incorrect. The actual range is [-4, 1.0051].
Now, let's see if integrating  twice with respect to x recovers our original function
 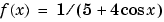 . The command
This is certainly not the original expression for  . Let's look at the difference
  .
.
We can simplify this using simple(d) or simplify(d). Either command produces
This illustrates the concept that differentiating  twice, then integrating the result twice, produces a function that may differ from
  by a linear function of
  .
.
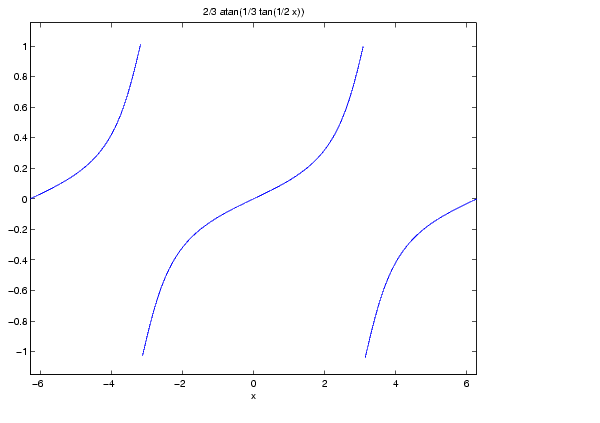
involves the arctangent function.
Though  is the antiderivative of a continuous function, it is itself discontinuous as the following plot shows.
Note that  has jumps at
  . This occurs because
  is singular at
  .
.
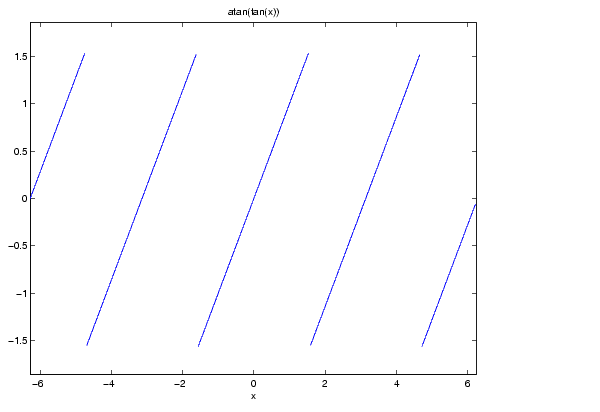
shows, the numerical value of atan(tan(x))differs from x by a piecewise constant function that has jumps at odd multiples of  .
.
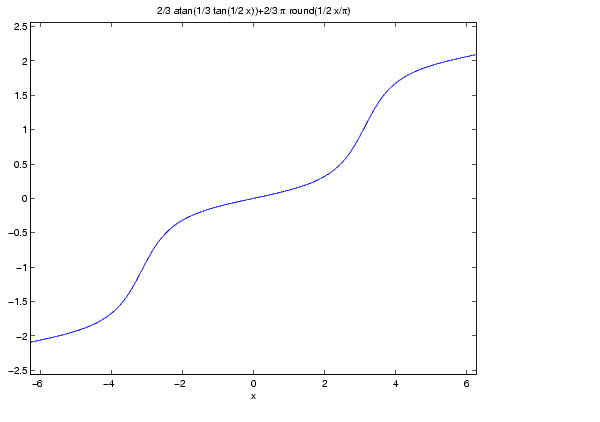
To obtain a representation of  that does not have jumps at these points, we must introduce a second function,
  , that compensates for the discontinuities. Then we add the appropriate multiple of
  to
to 
J = sym('round(x/(2*pi))');c = sym('2/3*pi');F1 = F+c*JF1 =2/3*atan(1/3*tan(1/2*x))+2/3*pi*round(1/2*x/pi)
This representation does have a continuous graph.
Notice that we use the domain [-6.28, 6.28] in ezplot rather than the default domain  . The reason for this is to prevent an evaluation of
 at the singular points
  and
and  where the jumps in F and J do not cancel out one another. The proper handling of branch cut discontinuities in multivalued functions like arctan x is a deep and difficult problem in symbolic computation. Although MATLAB and Maple cannot do this entirely automatically, they do provide the tools for investigating such questions.
| | Taylor Series | Simplifications and Substitutions | |
 :
:
 once more: