| Signal Processing Toolbox | |
Change sampling rate by any rational factor
Syntax
y=resample(x,p,q) y=resample(x,p,q,n) y=resample(x,p,q,n,beta) y=resample(x,p,q,b) [y,b]=resample(x,p,q)
Description
y resamples the sequence in vector = resample(x,p,q)
x at p/q times the original sampling rate, using a polyphase filter implementation. p and q must be positive integers. The length of y is equal to ceil(length(x)*p/q). If x is a matrix, resample works down the columns of x.
resample applies an anti-aliasing (lowpass) FIR filter to x during the resampling process. It designs the filter using firls with a Kaiser window.
y uses = resample(x,p,q,n)
n terms on either side of the current sample, x(k), to perform the resampling. The length of the FIR filter resample uses is proportional to n; larger values of n provide better accuracy at the expense of more computation time. The default for n is 10. If you let n = 0, resample performs a nearest-neighbor interpolation
where y(k) = 0 if the index to x is greater than length(x).
y uses beta as the design parameter for the Kaiser window that = resample(x,p,q,n,beta)
resample employs in designing the lowpass filter. The default for beta is 5.
y filters = resample(x,p,q,b)
x using the vector of filter coefficients b.
[y,b] returns the vector = resample(x,p,q)
b, which contains the coefficients of the filter applied to x during the resampling process.
Examples
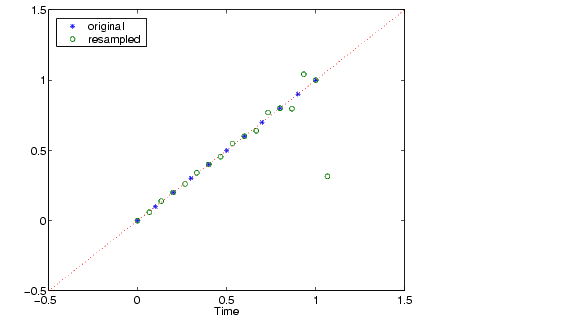
Resample a simple linear sequence at 3/2 the original rate:
fs1=10; % Original sampling frequency in Hz t1=0:1/fs1:1; % Time vector x=t1; % Define a linear sequence y=resample(x,3,2); % Now resample it t2=(0:(length(y)-1))*2/(3*fs1); % New time vector plot(t1,x,'*',t2,y,'o',-0.5:0.01:1.5,-0.5:0.01:1.5,':') legend('original','resampled'); xlabel('Time')
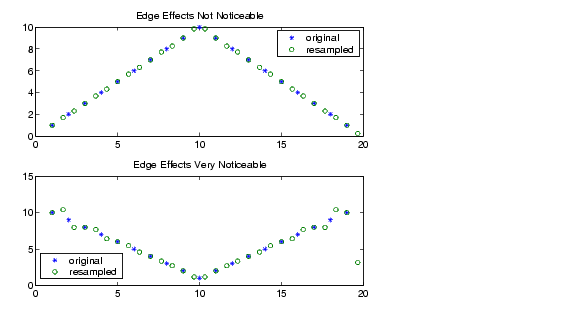
Notice that the last few points of the output y are inaccurate. In its filtering process, resample assumes the samples at times before and after the given samples in x are equal to zero. Thus large deviations from zero at the end points of the sequence x can cause inaccuracies in y at its end points. The following two plots illustrate this side effect of resample:
x=[1:10 9:-1:1]; y=resample(x,3,2); subplot(2,1,1); plot(1:19,x,'*',(0:28)*2/3 + 1,y,'o'); title('Edge Effects Not Noticeable'); legend('original','resampled'); x=[10:-1:1 2:10]; y=resample(x,3,2); subplot(2,1,2); plot(1:19,x,'*',(0:28)*2/3 + 1,y,'o') title('Edge Effects Very Noticeable'); legend('original','resampled');
Algorithm
resample performs an FIR design using firls, followed by rate changing implemented with upfirdn.
See Also
decimate, downsample, firls, interp, interp1, intfilt, kaiser, spline, upfirdn, upsample
| | remezord | residuez | |