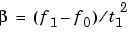
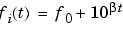
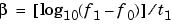
| Signal Processing Toolbox | |
Generate a swept-frequency cosine
Syntax
y=chirp(t,f0,t1,f1) y=chirp(t,f0,t1,f1,'method') y=chirp(t,f0,t1,f1,'method',phi) y=chirp(t,f0,t1,f1,'quadratic',phi,'shape')
Description
y = chirp(t,f0,t1,f1)
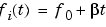
generates samples of a linear swept-frequency cosine signal at the time instances defined in array t, where f0 is the instantaneous frequency at time 0, and f1 is the instantaneous frequency at time t1. f0 and f1 are both in hertz. If unspecified, f0 is 0, t1 is 1, and f1 is 100.
Y = CHIRP(T,F0,T1,F1,' specifies alternative sweep method options, where method')
method can be:
Each of the above methods can be entered as 'li', 'q', and 'lo', respectively.
y = chirp(t,f0,t1,f1,' allows an initial phase method',phi)
phi to be specified in degrees. If unspecified, phi is 0. Default values are substituted for empty or omitted trailing input arguments.
y specifies the = chirp(t,f0,t1,f1,'quadratic',phi,'shape')
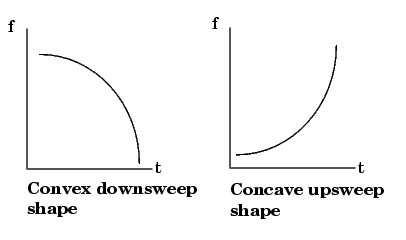
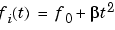
shape of the quadratic swept-frequency signal's spectrogram. shape is either concave or convex, which describes the shape of the parabola in the positive frequency axis. If shape is omitted, the default is convex for downsweep (f0 > f1) and is concave for upsweep (f0 < f1).
Example 1
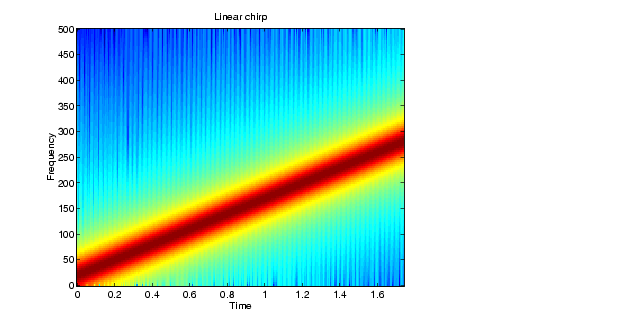
Compute the spectrogram of a chirp with linear instantaneous frequency deviation:
t=0:0.001:2; % 2 secs @ 1kHz sample rate y=chirp(t,0,1,150); % Start @ DC, cross 150Hz at t=1 sec specgram(y,256,1e3,256,250) % Display the spectrogram
Example 2
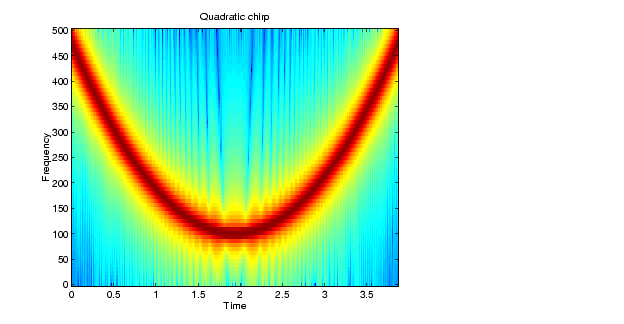
Compute the spectrogram of a chirp with quadratic instantaneous frequency deviation:
t=-2:0.001:2; % ±2 secs @ 1kHz sample rate y=chirp(t,100,1,200,'quadratic'); % Start @ 100Hz, cross 200Hz % at t=1 sec specgram(y,128,1e3,128,120) % Display the spectrogram
Example 3
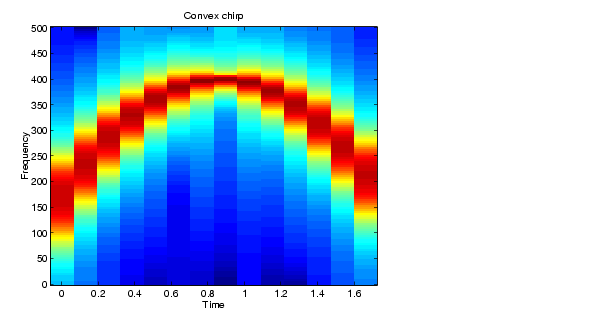
Compute the spectrogram of a convex quadratic chirp:
t= -1:0.001:1; % +/-1 second @ 1kHz sample ratefo=100; f1=400; % Start at 100Hz, go up to 400Hzy=chirp(t,fo,1,f1,'q',[],'convex');specgram(y,256,1000) % Display the spectrogram.
Example 4
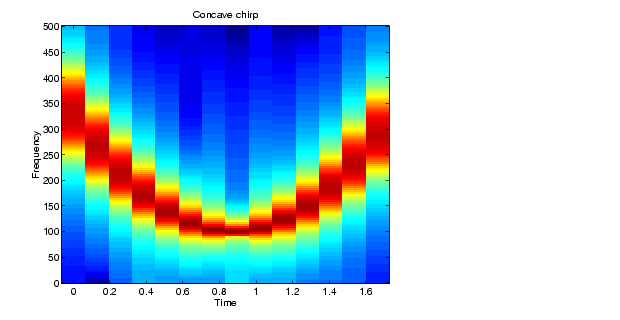
Compute the spectrogram of a concave quadratic chirp:
t= 0:0.001:1; % 1 second @ 1kHz sample ratefo=100; f1=25; % Start at 100Hz, go down to 25Hzy=chirp(t,fo,1,f1,'q',[],'concave');specgram(y,256,1000) % Display the spectrogram.
See Also
cos, diric, gauspuls, pulstran, rectpuls, sawtooth, sin, sinc, square, tripuls
| | cheby2 | cohere | |
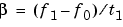
 ensures that the desired frequency breakpoint f1 at time t1 is maintained.