| Model Browser User's Guide | |
You might want to transform a response feature either to correct for nonnormality and/or a heteroscedastic variance structure. A useful class of transformations for this purpose is the power transform y , where is a parameter to be determined. Box and Cox (1964) showed how and the regression coefficients themselves could be estimated simultaneously using the method of maximum likelihood. The procedure consists of conducting a standard least squares fit using
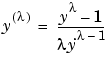 for
for 
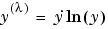 for
for 
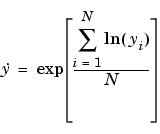
where the so called geometric mean of the observations is given by
The maximum likelihood estimate of corresponds to the value for which the SSE() from the fitted model is a minimum. This value of is determined by fitting a model (assumed throughout to be defined by the regression matrix for the full model - X) for various levels of and choosing the value corresponding to the minimum SSE(). A plot of SSE() versus is often used to facilitate this choice.
The parameter is swept between the range of -3 to 3 in increments of 0.5.
Although SSE() is a continuous function of , simple choices for are recommended. This is because the practical difference between 0.5 and 0.593, say, is likely to be very small but a simple transform like 0.5 is much easier to interpret.
You can also find an approximate 100(1- ) confidence interval on l by computing
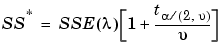
where  is the number of residual degrees of freedom equal to (N-q).
In this formula is understood to be the value that minimizes SSE(). Note that this confidence interval might encompass more than one incremental value for . In this case, any of these values is as valid as any other and you can select any of these transformations from which to develop trial models.
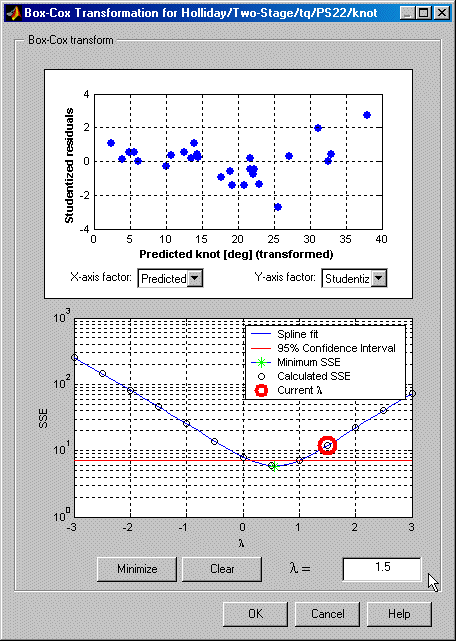
For the sake of clarity, consider the example following, which illustrates the outcome of applying the Box-Cox method.
The preceding example shows the results of applying the Box-Cox algorithm to a polyspline torque model.
In this example the minimum value of SSE() occurs near to =0. The minimum is marked in green. The 95% confidence limit has been calculated and drawn on the figure as a red solid line. It is apparent in this example that, after rounding to the nearest incremental value contained within the confidence interval, any in the range  is appropriate. Of the three possible increments, 0, 0.5, and 1, = 0.5 is the closest to the minimum SSE.
You can select any point on the plot by clicking. The chosen point (current lambda) is then outlined in red. You can also enter values of lambda directly in the edit box and press Return.
| | Stepwise Table | Linear Model Statistics Displays | |