
| Model Browser User's Guide |   |
Prediction Error Variance
Prediction Error Variance (PEV) is a very useful way to investigate the predictive capability of your model. It gives a measure of the precision of a model's predictions.
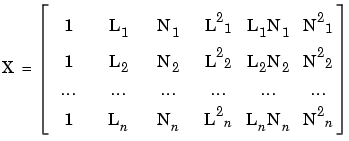
You start with the regression (or design) matrix, for example:

If you knew the actual model, you would know the actual model coefficients  . In this case the observations would be

where  is the measurement error with variance

However you can only ever know the predicted coefficients:


Let x be the regression matrix for some new point where you want to evaluate the model, for example:

Then the model prediction for this point is

Now you can calculate PEV as follows:


Note the only dependence on the observed values is in the variance (MSE) of the measurement error. You can look at the PEV(x) for a design (without MSE, as you don't yet have any observations) and see what effect it will have on the measurement error - if it is greater than 1 it will magnify the error, and the closer it is to 0 the more it will reduce the error.
You can examine PEV for designs or global models using the Prediction Error Variance viewer. When you open it from the Design Editor, you can see how well the underlying model predicts over the design region. When you open it from a global model, you can view how well the current global model predicts. A low PEV (tending to zero) means that good predictions are obtained at that point. See Prediction Error Variance Viewer.
For information on the calculation of PEV for two-stage models, see Prediction Error Variance for Two-Stage Models.
 | Definitions | High-Level Model Building Process Overview |  |