| Model Browser User's Guide |
  |
Data Selection Window
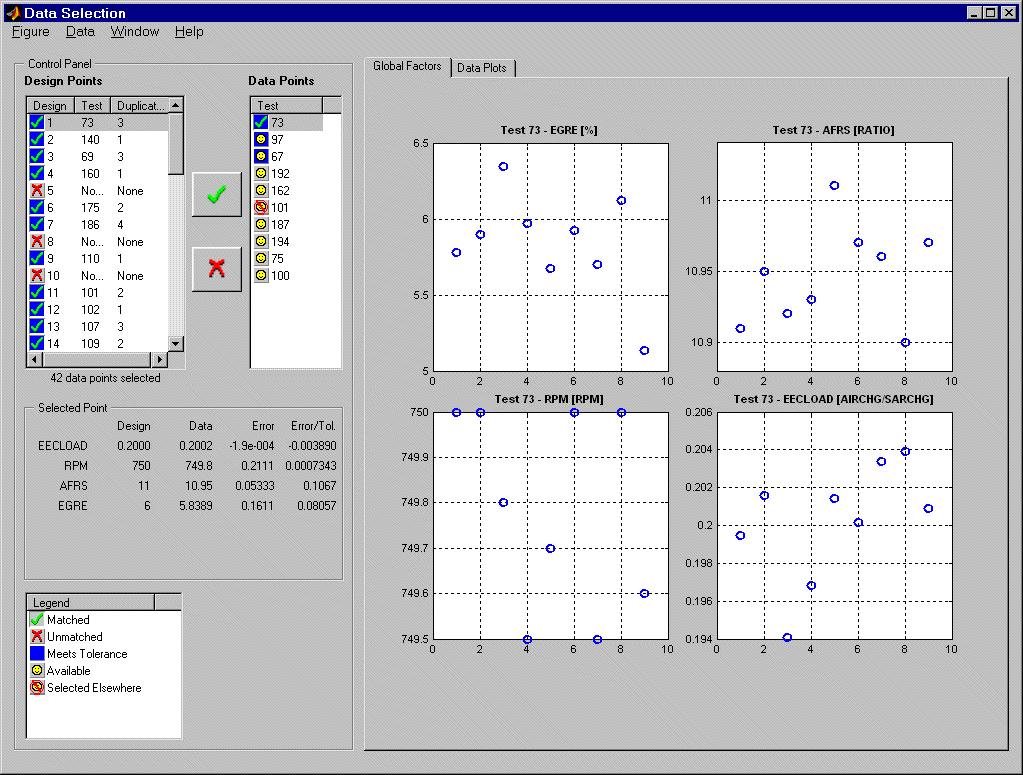
The Data Selection window is primarily for matching data to designs.
To reach the Data Selection window:
- From the test plan node, click the Select Data
 button in the toolbar.
- Alternatively, choose TestPlan -> Select Data.
The Data Selection window appears.
Note
If the current test plan has no data loaded (in which case you can see `No Data is selected' in the top right Data Sets pane) these actions open the Data Wizard instead.
|
You can also select the check box Open data selection figure on finish in the Data Wizard. This check box is selected by default when you select Matching selected data to design.
There is an option to match data to a design or select all available data from a particular data set.
Data Menu
- New -- Opens the Data Wizard to select a new data set to match to the design.
- Augment -- If there are data left over (that is, not matched to design points using current tolerances), this command opens a dialog where you can select tests to add. More data might be useful despite not matching original design points.
- Tolerances -- Opens the Matching Tolerances dialog, where you can set limits for matching data points to design points. See also the relevant Data Wizard help: Step 4: Set Tolerances.
- Input Signals -- Returns to the input signal setup (step 2 of the Data Wizard).
- Setup Plots -- Opens a dialog where you can select variables to plot (including any variables in the data set, not just those used in modeling).
Matching to designs always occurs at the outer level.
Matching to Design (Two-Stage)
All matching is performed at the second stage.
- Tests with fewer observations than the number of local model parameters are not selected.
- The ten closest matches are displayed in the data points list.
- You can select data points with the check mark button and clear them with the cross button.
Icon information
- A selected data or design point has a check mark icon.
- If a point is within the matching tolerance it is colored blue.
- If a point is available to be matched it has a smiley face icon.
- If a point is not available to be matched (already matched) it has a smiley face icon with a line through it.
- If a point has not been matched it has a cross icon.
Plots
- A plot of the second stage inputs for the selected data point is shown on the first tab.
- The Data Plots tab allows the user to screen the data using other variables (for example, response or other unused variables).

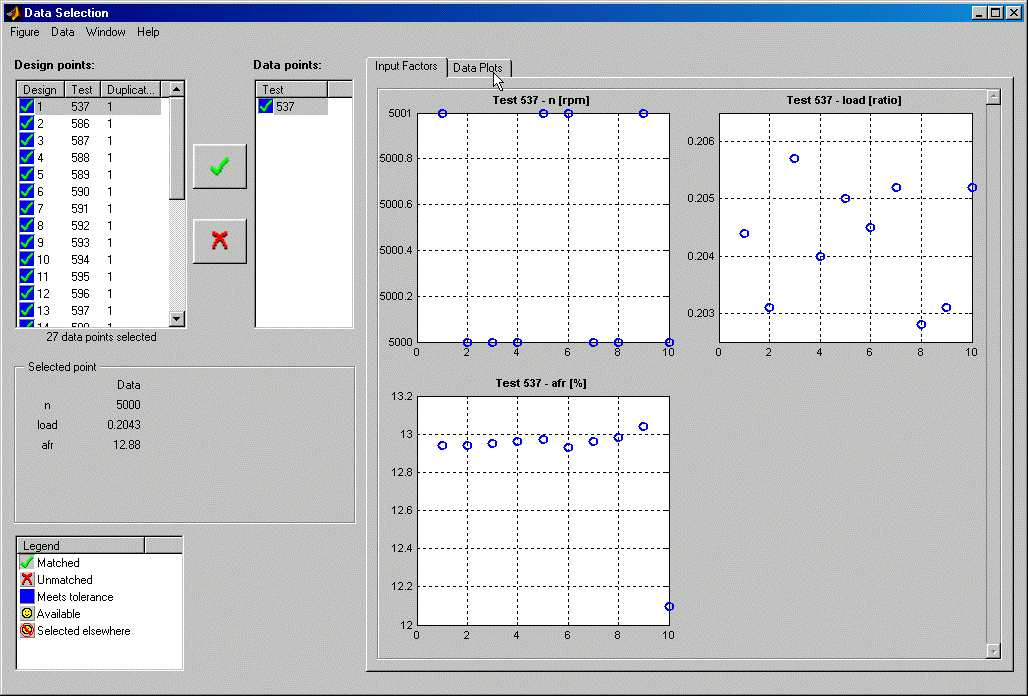
Selecting All the Data Set
Only one data point is shown in the data point list.
Tests with fewer observations than the number of stage 1 model parameters are not selected.

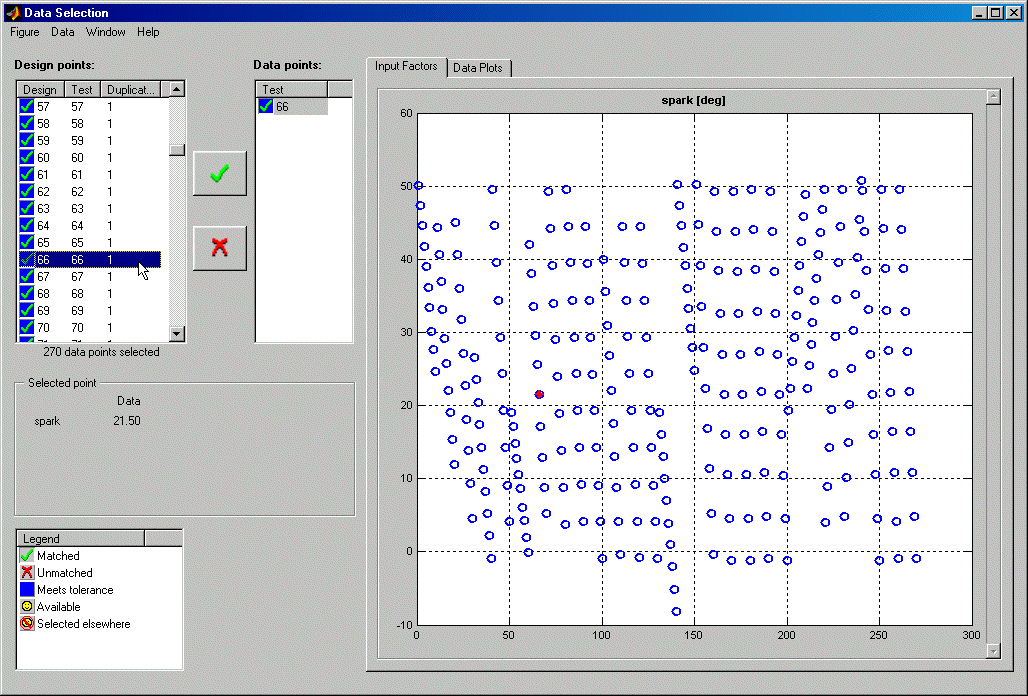
Selecting Data for One-Stage Models
This shows plots of all the tests at once, with one point per test (to plot each test individually would only plot one point). The selected test is highlighted red in the plot.

 | Data Wizard | | New Response Models |  |


 button in the toolbar.

