| Model Browser User's Guide | |
Prediction Error Variance Viewer
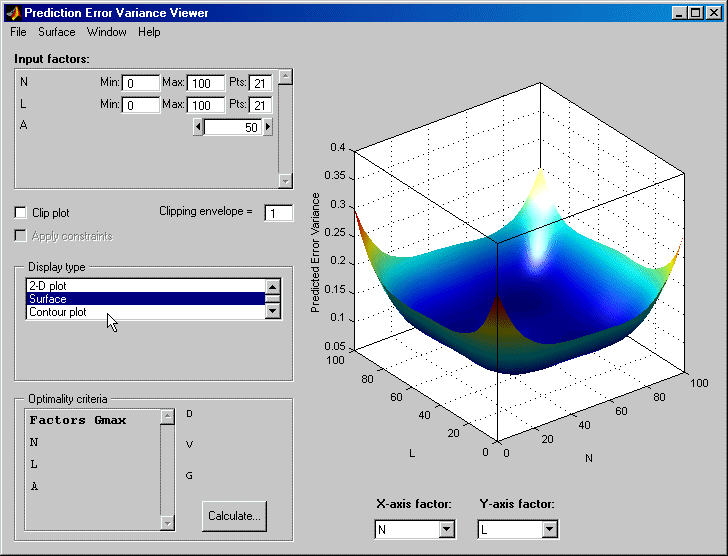
A useful measure of the quality of a design is its prediction error variance (PEV). The PEV hypersurface is an indicator of how capable the design is in estimating the response in the underlying model. A bad design is either not able to fit the chosen model or is very poor at predicting the response. The PEV Viewer is only available for linear models. The PEV Viewer is not available when designs are rank deficient; that is, they do not contain enough points to fit the model. Optimal designs attempt to minimize the average PEV over the design region.
The default view is a 3-D plot of the PEV surface.
This shows where the response predictions are best. This example optimal design predicts well in the center and the middle of the faces (one factor high and the other midrange), but in the corners the model has the highest error. Even in the corners the errors are small; looking at the scale, PEV values under 0.25 are not large.
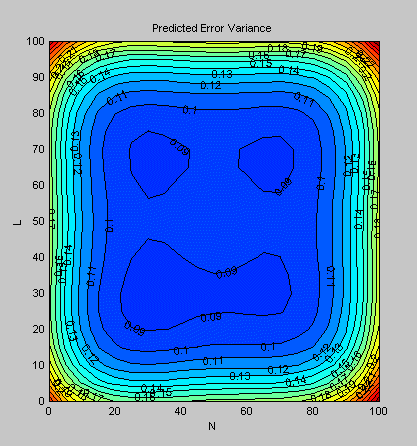
Try the other display options.
| | Design Displays | Improving the Design | |