| Model Browser User's Guide | |
Test Groupings
The Define Test Groupings dialog collects records of the current data object into groups; these groups are referred to as tests.
The dialog is accessed from the Data Editor in either of these ways:
When you enter the dialog, no plot is displayed.
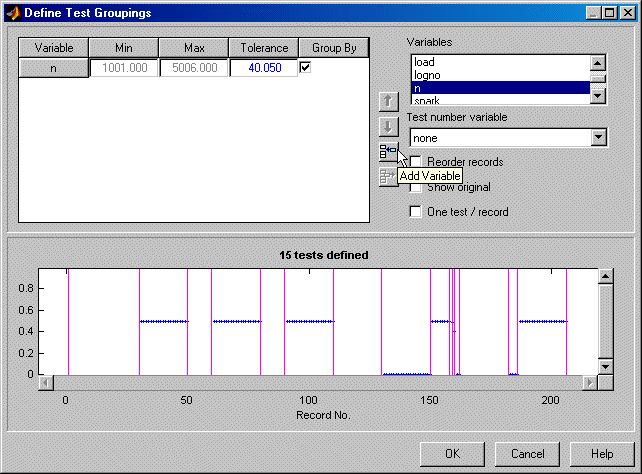
Select a variable to use in defining groups within the data.
n appears in the list view on the left, as seen in the following example. You can now use this variable to define groups in the data. The maximum and minimum values of n are displayed. The Tolerance is used to define groups: on reading through the data, when the value of n changes by more than the tolerance, a new group is defined. You change the Tolerance by typing directly in the edit box.
You can define addlitional groups by selecting another variable and choosing a tolerance. Data records are then grouped by n or by this additional variable changing outside their tolerances.
 .
.
load in the list view (it becomes highlighted in blue).
load, by clicking the  button.
n was plotted and used to define groups.
Reorder records allows records in the data set to be reordered before grouping. Otherwise the groups are defined using the order of records in the original data object.
Show original displays the original test groupings if any were defined.
One test/record defines one test per record, regardless of any other grouping. This is required if the data is to be used in creating one-stage models.
Test number variable contains a pop-up menu showing all the variables in the current data set. Any of these can be selected to number the tests.
If you chose none from the Test number variable list, the tests would be numbered 1,2,3 and so on in the order in which the records appear in the data file.
Every record in a test must share the same test number to identify it, so when you are using a variable to number tests, the value of that variable is taken in the first record in each test.
Test numbers must be unique, so if any values in the chosen variable are the same, they are assigned new test numbers for the purposes of modeling (this does not change the underlying data, which retains the correct test number or other variable).
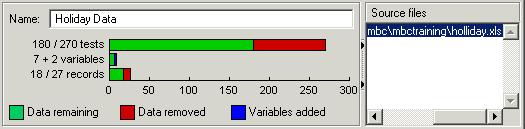
The number of records shows the number of values left (after filtration) of each variable in this data set, followed by the original number of records. The color coded bars also display the number of records removed as a proportion of the total number. The values are collected into a number of tests; this number is also displayed. The variables show the original number of variables plus user-defined variables.You can remove or show the legend explaining the color coding by clicking the button.
| | Storage | GUI Reference | |