| Mapping Toolbox | |
Values between waypoints on a regular matrix map.
Syntax
[z,rng,lat,lon] = mapprofile(map,maplegend,lat,lon)
[z,rng,lat,lon] = mapprofile(map,maplegend,lat,lon,rngunits)
[z,rng,lat,lon] = mapprofile(map,maplegend,lat,lon,ellipsoid)
[z,rng,lat,lon] = mapprofile(map,maplegend,lat,lon,rngunits,trackmethod,interpmethod)
Description
mapprofile plots a profile of values between waypoints on a displayed regular matrix map. mapprofile uses the current object if it is a regular matrix map, or the first regular matrix map found on the current axes. The map's zdata is used for the profile. The color data is used in the absence of data in z. The result is displayed in a new figure.
[z,rng,lat,lon] = mapprofile returns the values of the profile without displaying them. The output z contains interpolated values from map along great circles between the waypoints. Rng is a vector of associated distances from the first waypoint in units of degrees of arc along the surface. Lat and lon are the corresponding latitudes and longitudes.
[z,rng,lat,lon] = mapprofile(map,maplegend,lat,lon) uses the provided regular matrix map and waypoint vectors. No displayed map is required. Sets of waypoints may be separated by NaNs into line sequences. The output ranges are measured from the first waypoint within a sequence.
[z,rng,lat,lon] = mapprofile(map,maplegend,lat,lon,rngunits) specifies the units of the output ranges along the profile. Valid range units inputs are any distance string recognized by DISTDIM. Surface distances are computed using the default radius of the earth. If omitted, 'degrees' are assumed.
[z,rng,lat,lon] = mapprofile(map,maplegend,lat,lon,ellipsoid) uses the provided ellipsoid definition in computing the range along the profile. The ellipsoid vector is of the form [semimajor axes, eccentricity]. The output range is reported in the same distance units as the semimajor axes of the ellipsoid vector. If omitted, the range vector is for a sphere.
[z,rng,lat,lon] = mapprofile(map,maplegend,lat,lon,rngunits,trackmethod,interpmethod) and [z,rng,lat,lon] = mapprofile(map,maplegend,lat,lon,ellipsoid,trackmethod,interpmethod) control the interpolation methods used. Valid trackmethods are 'gc' for great circle tracks between waypoints, and 'rh' for rhumb lines. Valid interpmethods for interpolation within the matrix are 'bilinear' for linear interpolation, 'bicubic' for cubic interpolation, and 'nearest' for nearest neighbor interpolation. If omitted, 'gc' and 'bilinear' are assumed.
Example
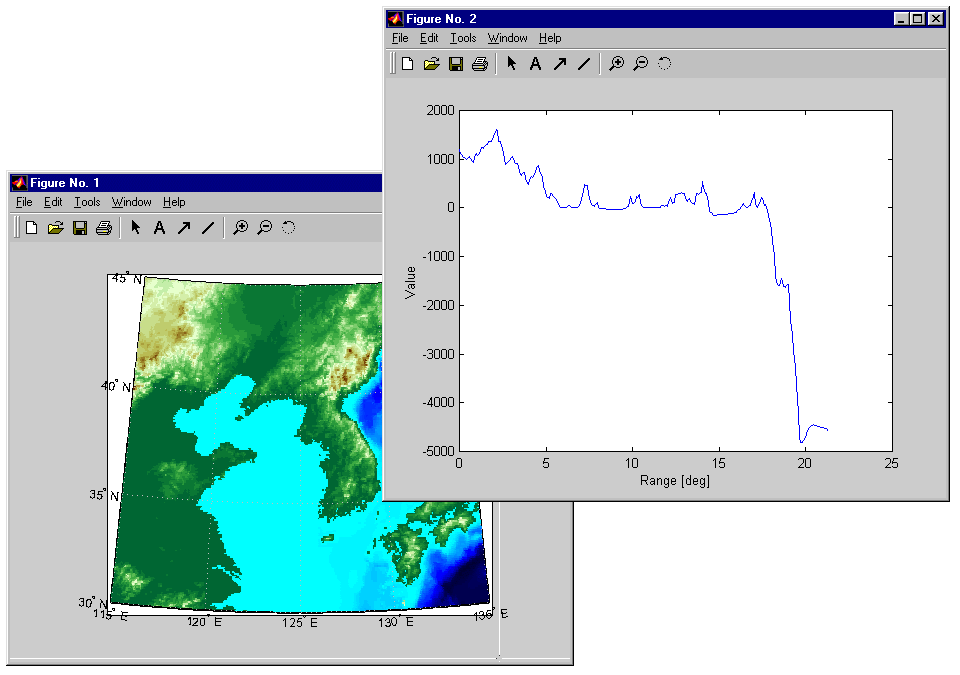
What is the elevation profile across the sample Korean digital elevation data? Take the data and the way points from a map display. Click on the upper left and the lower right corners of the map, and then press the Enter key.
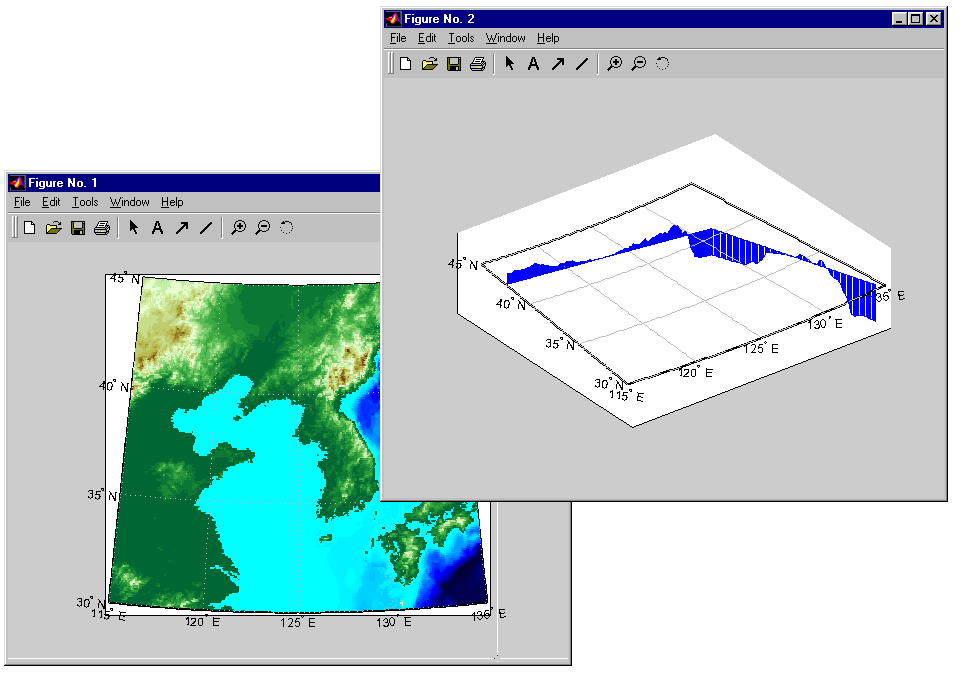
When you select more than two wayppoints, the automatically generated figure displays the result in three dimensions. The following example shows the relative sizes of the mountains in northern China compared to the depths of the Sea of Japan.
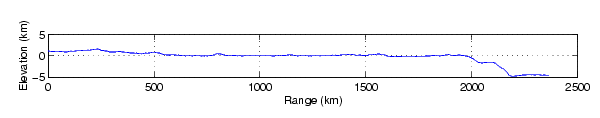
Adding output arguments supresses the display of the results in a new figure. You can then use the results in furthur calculations, or display the results yourself. Here the profile from the upper left to lower right is computed from waypoints selected on the map. The ranges and elevations are converted to kilometers and displayed in a new figure. The vertical exaggeration factor is set to 20. With no vertical exaggeration, the changes in elevation would be to almost to small to see.
[z,rng,lat,lon] = mapprofile;
figure
plot(deg2km(rng),z/1000)
daspect([ 1 1/20 1 ]); grid
xlabel 'Range (km)'
ylabel 'Elevation (km)'
You can compute values along a path without reference to an existing figure by providing a regular matrix map and vectors of waypoint coordinates. Optional arguments allow control over the units of the range output and interpolation methods between waypoints and matrix elements.
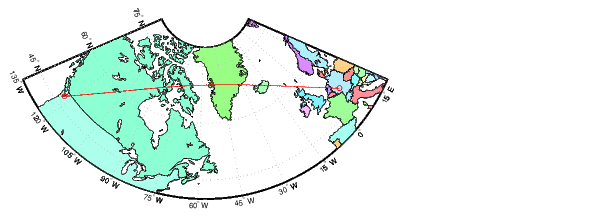
Find the countries that lie under a great circle track from Frankfurt to Seattle. Use the 15 minute (25 kilometer) worldmtxmed political matrix map data.
load worldmtxmed
[lat,lon] =
extractm(worldlo('PPpoint'),{'Seattle','Frankfurt'});
lat(isnan(lat)) = []; lon(isnan(lon)) = [];
[lat lon]

ans =

   50.1082    8.6732
   47.5070 -122.3589


[valp,rngp,latp,lonp] =
mapprofile(double(map),maplegend,lat,lon,'km','gc','nearest');

ucodes = unique(valp)

ucodes =

    35
    71
    74
    86
   132
   194
   207

unames = names(ucodes)

unames =

    'Canada'
    'Germany'
    'Greenland'
    'Iceland'
    'Netherlands'
    'United States'
    'Water'


plot(rngp,valp,'.')
xlabel 'Range (km)'
ylabel 'Country Code'
set(gca,'ytick',ucodes)
set(gca,'yticklabel',unames)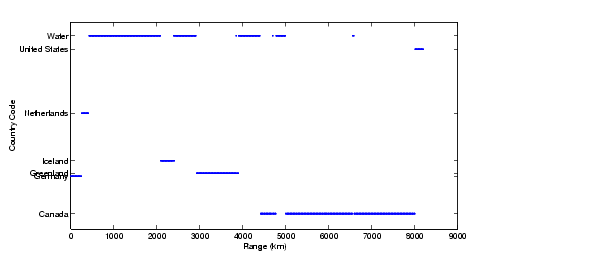
Verify the result by displaying the track on a map.
See Also
ltln2val |
Values for position on a regular matrix map. |
los2 |
Line of sight between two points. |
| | map legend vector | maps | |