| Mapping Toolbox | |
Displaying Vector Maps as Patches
Vector map data that is properly formatted can be displayed as a patch, or filled-in polygon. Like many Mapping Toolbox functions, the names of the patch map display functions can be determined by appending an 'm' to its MATLAB counterpart (e.g., add an 'm' to patch to get patchm).
Note
The Mapping Toolbox patch display commands differ from their MATLAB equivalents by allowing you to display patch vector data that use NANs to separate faces.
|
The following table lists the available Mapping Toolbox patch display functions:
| Function |
Used to Create |
|
Filled 2-D map polygons |
|
Filled 3-D map polygons in 3-D space |
|
Patch objects projected on map axes |
|
Patches projected as individual objects on map axes |
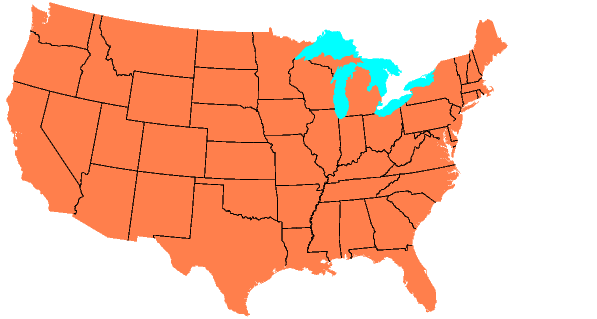
The usalo MAT-file is useful for illustrating patches:
load usalo
who
Your variables are:

conus          gtlakelon      statelat       uslon
greatlakes     state          statelon
gtlakelat      stateborder    uslat
The variables uslat and uslon together describe three polygons (separated by NaNs) representing the continental United States. The smaller polygons are necessary to display Long Island and Martha's Vineyard. The variables gtlakelat and gtlakelon describe three polygons (separated by NaNs) for the Great Lakes. The variables statelat and statelon contain line-segment data (separated by NaNs) for the borders between states, which is not formatted for patch display.
Conic projections make good displays of the United States, so create a map axes using an Albers Equal-Area Conic projection. By specifying map limits that contain the region of interest, you automatically center the projection on an appropriate longitude, and the frame encloses just the mapping area, not the entire globe.
A good rule-of-thumb for conic projections is to set the standard parallels at one-sixth of the distance from both latitude limits. You can do this automatically by providing an empty matrix as the standard parallel:
axesm('MapProjection','eqaconic','MapParallels',[],...
      'MapLatLimit',[23 52],'MapLonLimit',[-130 -62])
When patch data is displayed, layering can become important as objects above can hide objects below. You can control the visibility of objects by the order of their display and by their "altitude" position. For this reason, the primary patch display function in the Mapping Toolbox, fillm, allows you to control the z-axis level of displayed patches. Here the land data is displayed at the default level, z=0. The Great Lakes data is assigned the altitude of z=1. To plot the line segment data between these layers, use the plot3m command and specify an altitude of 0.5:
fillm(uslat,uslon,'FaceColor',[1 .5 .3],'EdgeColor','none')
fillm(gtlakelat,gtlakelon,1,...
      'FaceColor','cyan','EdgeColor','none')
plot3m(statelat,statelon,0.5,'k')
The fillm function makes use of the low-level function patchm. The Mapping Toolbox provides another patch drawing function called patchesm. The optimal use of either depends on the application and user preferences. The patchm function creates one displayed object and returns one handle for a patch, which may contain multiple, not necessarily connecting, faces. The Mapping Toolbox uses NaNs to separate non-connected patch faces, unlike MATLAB, which does not handle NaN clipped data for patches. For the patchesm function, each face is a separate object with its own handle. In general, patchm requires more memory but is faster than patchesm.
| | Displaying Vector Maps as Lines | Displaying Matrix Maps | |