| Mapping Toolbox | |
Displaying Vector Maps as Lines
The Mapping Toolbox lets you display vector map data as line objects much like the line display commands in MATLAB. The Mapping Toolbox line graphics functions have MATLAB analogs, the names of which can usually be determined by appending an 'm' to the MATLAB function name. For instance, the Mapping Toolbox version of plot is plotm.
The following table lists the available Mapping Toolbox line display functions:
| Function |
Used to Create |
|
Contour plot of map data |
|
Contour plot of map data in 3-D space |
|
Line objects projected on map axes |
|
Lines projected on map axes |
|
Lines projected on map axes in 3-D space |
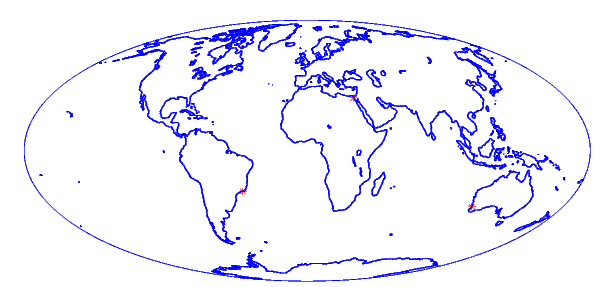
Plot the coast vector data using plotm. Just as with plot, you can specify line property names and values in the command:
load coast
axesm mollweid
framem('FEdgeColor','blue','FLineWidth',0.5)
plotm(lat,long,'LineWidth',1,'Color','blue')
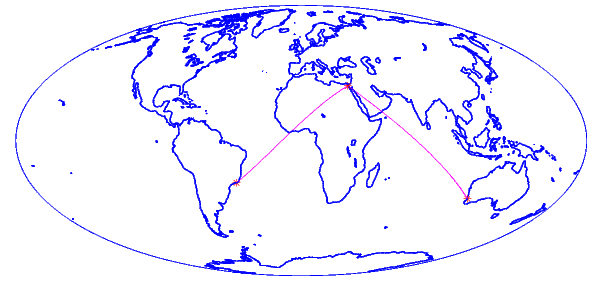
Sometimes vector data represent specific points. Suppose you have variables representing the locations of Cairo (30°N,32°E), Rio de Janeiro (23°S,43°W), and Perth (32°S,116°E), and you want to plot them as markers only, without connecting line segments.
In addition to these sorts of "permanent" geographic data, you can also display calculated vector data. Calculate and plot a great circle track from Cairo to Rio de Janeiro, and a rhumb line track from Cairo to Perth:
[gclat,gclong] = track2('gc',citylats(1),citylongs(1),...
                             citylats(2),citylongs(2));
[rhlat,rhlong] = track2('rh',citylats(1),citylongs(1),...
                             citylats(3),citylongs(3));
plotm(gclat,gclong,'m-'); plotm(rhlat,rhlong,'m-')
| | Projected and Unprojected Objects | Displaying Vector Maps as Patches | |