| Mapping Toolbox | |
Project data in a geographic data structure
Syntax
Description
displaym(mstruct) will project the data contained in the input structure onto the current axes. The current axes must have a valid map definition. The input mstruct must be a valid Mapping Toolbox Geographic Data Structure.
displaym(mstruct,'object') will display vector data from entries in the Mapping Toolbox Geographic Data structure whose tags begin with the 'object' string. The output vectors use NaNs to separate the individual entries in the map structure. Matches of the tag string must be vector data (lines and patches) to be included in the output. The search is not case-sensitive.
displaym(mstruct,objects) where objects is a character array or a cell array or strings, allows more than one object to be the basis for the search. Character array objects will have trailing spaces stripped before matching.
[lat,lon] = displaym(mstruct,objects,'exact') requires an exact match to extract data.
h = displaym(mstruct,...) returns the handles to the objects projected.
Examples
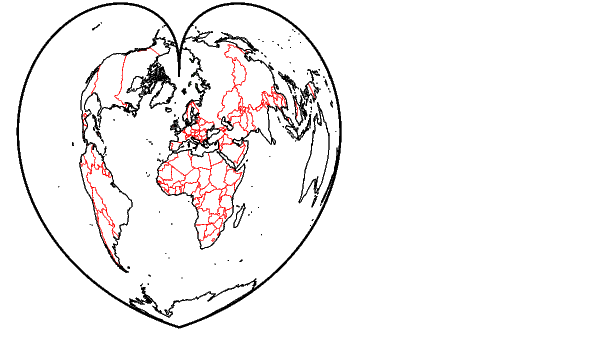
Display political and coast lines contained in structure format:
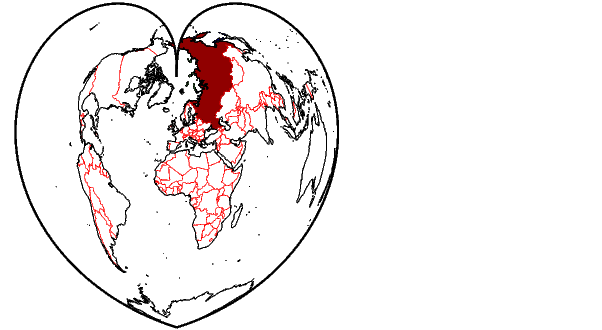
Highlight Russia by displaying a patch map of the country:
Remarks
A Mapping Toolbox geographic data structure is a MATLAB structure that may contain line, patch, text, regular matrix map, general matrix map, and light objects.
Object properties used in the display are taken from the otherproperty field of the structure. If a line or patch object's otherproperty field is empty, displaym uses default colors. A patch is assigned an index into the current colormap based on the structure's tag field. Lines are assigned colors from the current color order according to their tags.
See Also
extractm |
Extract vector data from geographic data structures |
geographic data structure |
Specially formatted structure for map data |
mlayers |
GUI for manipulating layers of a geographic data structure |
| | departure | dist2str | |