| Mapping Toolbox | |
Astronomical Data
Although the Earth may be the most commonly mapped object, the same cartographic techniques are used to map the stars and planets. As an example of such astronomical data, the Mapping Toolbox includes map data for the Earth's moon and the stars.
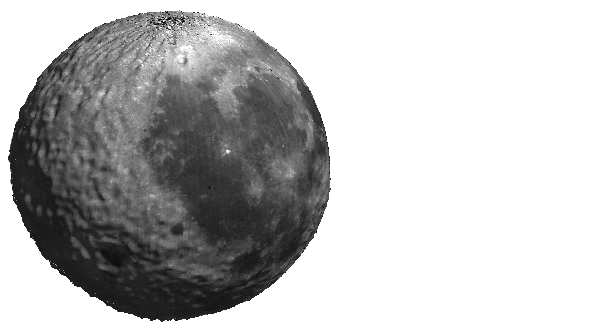
The moon data is low resolution topography and albedo (reflectance) from the Clementine spacecraft. Topography, found in the moontopo.mat file, is a 1-degree regular matrix map in units of meters. Albedo is stored as a 3-cells- per-degree integer image in the moonalb.mat file. The loadmoonalb script reads the albedo image and converts it to double precision numbers for display. Here is the albedo image texture mapped onto the topography, vertically exaggerated by a factor of 10.
load moontopo; loadmoonalb
axesm('globe','geoid',almanac('moon','radius','m'))
h = meshm(moontopo,moontopolegend,size(moontopo),10*moontopo);
set(h,'CData',moonalb,'FaceColor','texturemap')
colormap(gray); view(20,20)
camlight; material dull; lighting phong
Star positions and magnitudes are found in the stars MAT-file.
load stars
whos
This is a set of more than 4500 star locations and visual magnitudes derived from the Fifth Fundamental Catalog of Stars parts I and II (FK5 and FK5e). Other star data such as mean errors, proper motions, spectral types, parallaxes, radial velocities, and cross identifications to other catalogues can be obtained from the catalog using the readfk5 interface function described in External Data Interface.
The positions of stars in equatorial coordinates are given in the vectors lat and long. These are latitudes and longitudes in degrees for the stars as seen from within the celestial sphere. The visual magnitude of each star is given in the vector vmag. Stars are typically plotted with diameters proportional to the relative intensity. The vector relintensity contains modified vmag data suitable for display with scatterm to exhibit this proportional diameter. All intensities are positive, and brighter stars have a larger relintensity number.
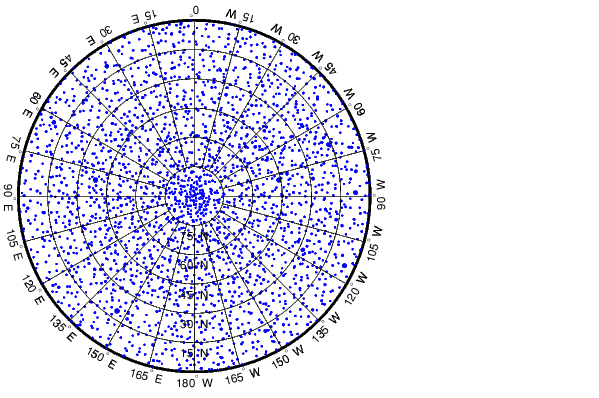
Display the stars of the northern sky in the Equidistant azimuthal projection. Scale the realive intensities to:
axesm eqdazim
framem; gridm; mlabel; plabel
setm(gca,'Origin',[90 180 0],'FLatLimit',[-inf 90],...
    'MLabelLocation',-180:15:165,'MLineLocation',15,...
    'MLineLimit',[-75 75],'MLabelParallel','equator',...
    'PLabelMeridian',180,'PLabelLocation',15:15:75,...
    'LabelRotation','on''GLineWidth',.01,...
    'GLineStyle','-')
set(handlem('alltext'),...
    'VerticalAlignment','top','HorizontalAlignment','center')
h = scatterm(lat,long,sqrt(relintensity)*30,'filled');
You may be able to identify the Big Dipper, or the constellation of Ursa Major, located at 180° E, 60° N.
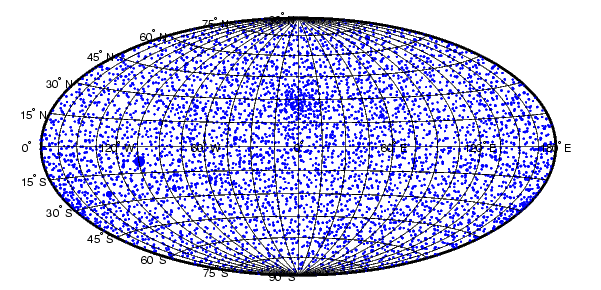
Another system used to describe the positions of heavenly bodies is galactic coordinates. This coordinate system puts the center of our galaxy at the origin and places the north pole so that the Milky Way is aligned with the galactic equator. The positions of the stars in this coordinate system are given in the vectors glat and glong. Stars in galactic coordinates are typically plotted in a pseudo-cylindrical projection like the Hammer:
figure
axesm hammer
framem; gridm; mlabel; plabel
setm(gca,'GLineWidth',.01,'GLineStyle','-',...
    'MLineLocation',15,'MLabelParallel','equator',...
    'MLabelLocation',-120:60:180)
scatterm(glat,glong,sqrt(relintensity)*30,'filled')
See External Data Interface for more information on how to convert between these two systems.
| | Terrain | Map Projections | |