| Fuzzy Logic Toolbox | |
The Fuzzy Inference Diagram
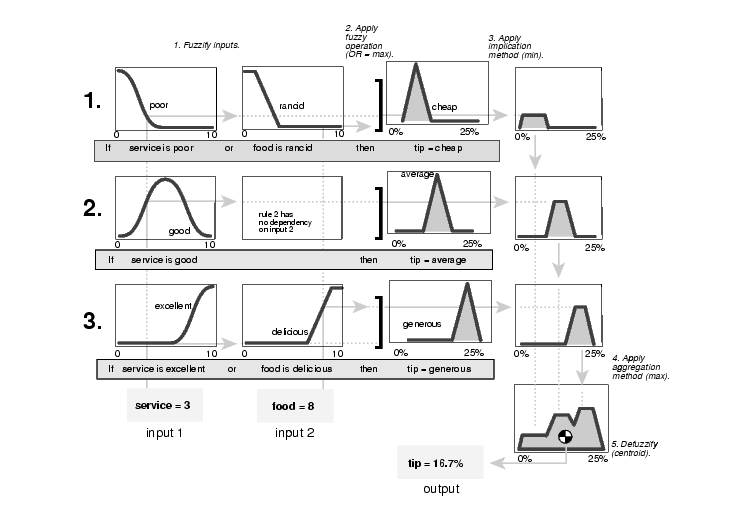
The fuzzy inference diagram is the composite of all the smaller diagrams we've been looking at so far in this section. It simultaneously displays all parts of the fuzzy inference process we've examined. Information flows through the fuzzy inference diagram as shown below.
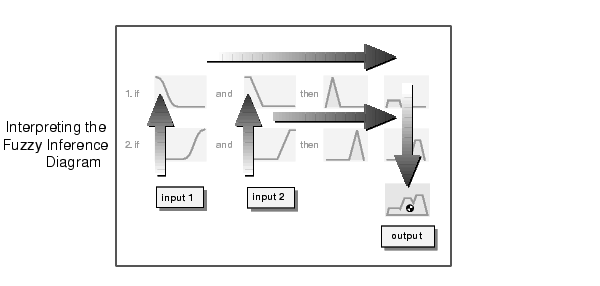
Notice how the flow proceeds up from the inputs in the lower left, then across each row, or rule, and then down the rule outputs to finish in the lower right. This is a very compact way of showing everything at once, from linguistic variable fuzzification all the way through defuzzification of the aggregate output.
Shown below is the real full-size fuzzy inference diagram. There's a lot to see in a fuzzy inference diagram, but once you become accustomed to it, you can learn a lot about a system very quickly. For instance, from this diagram with these particular inputs, you can easily see that the implication method is truncation with the min function. The max function is being used for the fuzzy OR operation. Rule 3 (the bottom-most row in the diagram shown previously) is having the strongest influence on the output. And so on. The Rule Viewer described in The Rule Viewer is a MATLAB implementation of the fuzzy inference diagram.
| | Dinner for Two, Reprise | Customization | |