
| Fuzzy Logic Toolbox |   |
The Rule Viewer

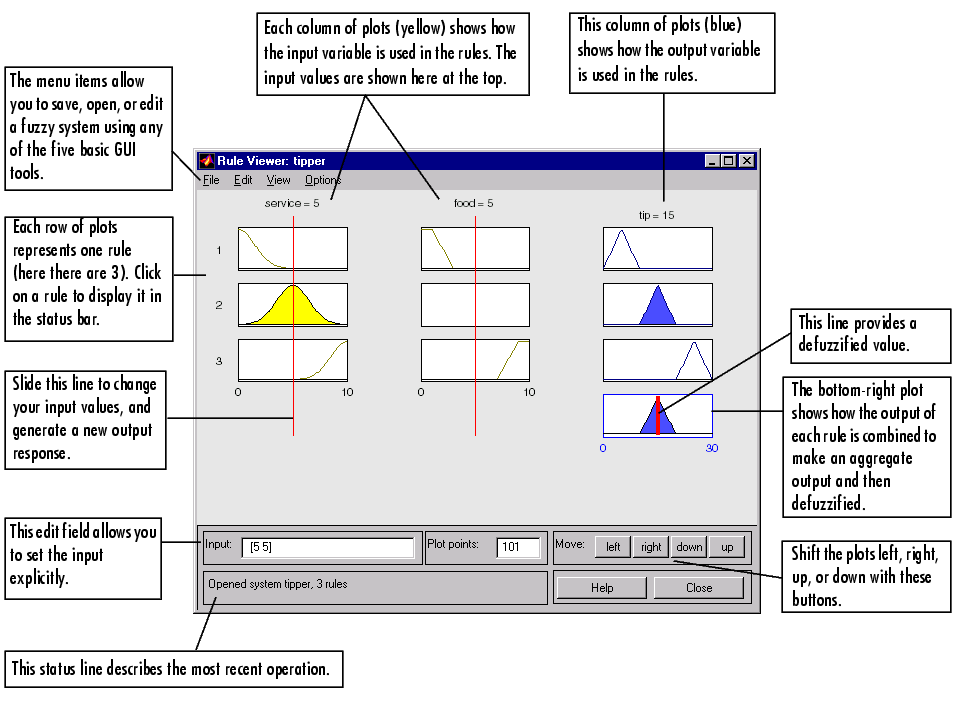
The Rule Viewer displays a roadmap of the whole fuzzy inference process. It's based on the fuzzy inference diagram described in the previous section. You see a single figure window with 10 small plots nested in it. The three small plots across the top of the figure represent the antecedent and consequent of the first rule. Each rule is a row of plots, and each column is a variable. The first two columns of plots (the six yellow plots) show the membership functions referenced by the antecedent, or the if-part of each rule. The third column of plots (the three blue plots) shows the membership functions referenced by the consequent, or the then-part of each rule. If you click once on a rule number, the corresponding rule will be displayed at the bottom of the figure. Notice that under food, there is a plot which is blank. This corresponds to the characterization of none for the variable food in the second rule. The fourth plot in the third column of plots represents the aggregate weighted decision for the given inference system. This decision will depend on the input values for the system.
There are also the now familiar items like the status line and the menu bar. In the lower right there is a text field into which you can enter specific input values. For the two-input system, you will enter an input vector, [9 8], for example, and then click on Input. You can also adjust these input values by clicking anywhere on any of the three plots for each input. This will move the red index line horizontally, to the point where you have clicked. You can also just click and drag this line in order to change the input values. When you release the line, (or after manually specifying the input), a new calculation is performed, and you can see the whole fuzzy inference process take place. Where the index line representing service crosses the membership function line "service is poor" in the upper left plot will determine the degree to which rule one is activated. A yellow patch of color under the actual membership function curve is used to make the fuzzy membership value visually apparent. Each of the characterizations of each of the variables is specified with respect to the input index line in this manner. If we follow rule 1 across the top of the diagram, we can see the consequent "tip is cheap" has been truncated to exactly the same degree as the (composite) antecedent--this is the implication process in action. The aggregation occurs down the third column, and the resultant aggregate plot is shown in the single plot to be found in the lower right corner of the plot field. The defuzzified output value is shown by the thick line passing through the aggregate fuzzy set.
The Rule Viewer allows you to interpret the entire fuzzy inference process at once. The Rule Viewer also shows how the shape of certain membership functions influences the overall result. Since it plots every part of every rule, it can become unwieldy for particularly large systems, but, for a relatively small number of inputs and outputs, it performs well (depending on how much screen space you devote to it) with up to 30 rules and as many as 6 or 7 variables.
The Rule Viewer shows one calculation at a time and in great detail. In this sense, it presents a sort of micro view of the fuzzy inference system. If you want to see the entire output surface of your system, that is, the entire span of the output set based on the entire span of the input set, you need to open up the Surface Viewer. This is the last of our five basic GUI tools in the Fuzzy Logic Toolbox, and you open it by selecting View surface... from the View menu.
 | The Rule Editor | The Surface Viewer |  |