
| Fuzzy Logic Toolbox |   |
Fuzzy C-Means Clustering
Fuzzy c-means (FCM) is a data clustering technique wherein each data point belongs to a cluster to some degree that is specified by a membership grade. This technique was originally introduced by Jim Bezdek in 1981 [Bez81] as an improvement on earlier clustering methods. It provides a method that shows how to group data points that populate some multidimensional space into a specific number of different clusters.
The Fuzzy Logic Toolbox command line function fcm starts with an initial guess for the cluster centers, which are intended to mark the mean location of each cluster. The initial guess for these cluster centers is most likely incorrect. Additionally, fcm assigns every data point a membership grade for each cluster. By iteratively updating the cluster centers and the membership grades for each data point, fcm iteratively moves the cluster centers to the "right" location within a data set. This iteration is based on minimizing an objective function that represents the distance from any given data point to a cluster center weighted by that data point's membership grade.
fcm is a command line function whose output is a list of cluster centers and several membership grades for each data point. You can use the information returned by fcm to help you build a fuzzy inference system by creating membership functions to represent the fuzzy qualities of each cluster.
An Example: 2-D Clusters
Let's use some quasi-random two-dimensional data to illustrate how FCM clustering works. Load a data set and take a look at it.
Now we invoke the command-line function, fcm, and ask it to find two clusters in this data set
[center,U,objFcn] = fcm(fcmdata,2);
    Iteration count = 1, obj. fcn = 8.941176
    Iteration count = 2, obj. fcn = 7.277177
until the objective function is no longer decreasing much at all.
The variable center contains the coordinates of the two cluster centers, U contains the membership grades for each of the data points, and objFcn contains a history of the objective function across the iterations.
The fcm function is an iteration loop built on top of several other routines, namely initfcm, which initializes the problem, distfcm, which is used for distance calculations, and stepfcm, which steps through one iteration.
Plotting the objective function shows the progress of the clustering.
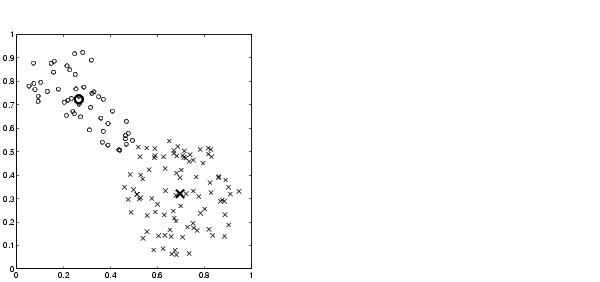
Finally, here is a plot displaying the two separate clusters classified by the fcm routine. The following figure is generated using
load fcmdata.dat
[center, U, obj_fcn] = fcm(fcmdata, 2);
maxU = max(U);
index1 = find(U(1, :) == maxU);
index2 = find(U(2, :) == maxU);
line(fcmdata(index1, 1), fcmdata(index1, 2), 'linestyle',...
'none','marker', 'o','color','g');
line(fcmdata(index2,1),fcmdata(index2,2),'linestyle',...
'none','marker', 'x','color','r');
hold on
plot(center(1,1),center(1,2),'ko','markersize',15,'LineWidth',2
)
plot(center(2,1),center(2,2),'kx','markersize',15,'LineWidth',2
)
Cluster centers are indicated in the figure below by the large characters.

 | Fuzzy Clustering | Subtractive Clustering |  |