

| Fuzzy Logic Toolbox | |
The Surface Viewer
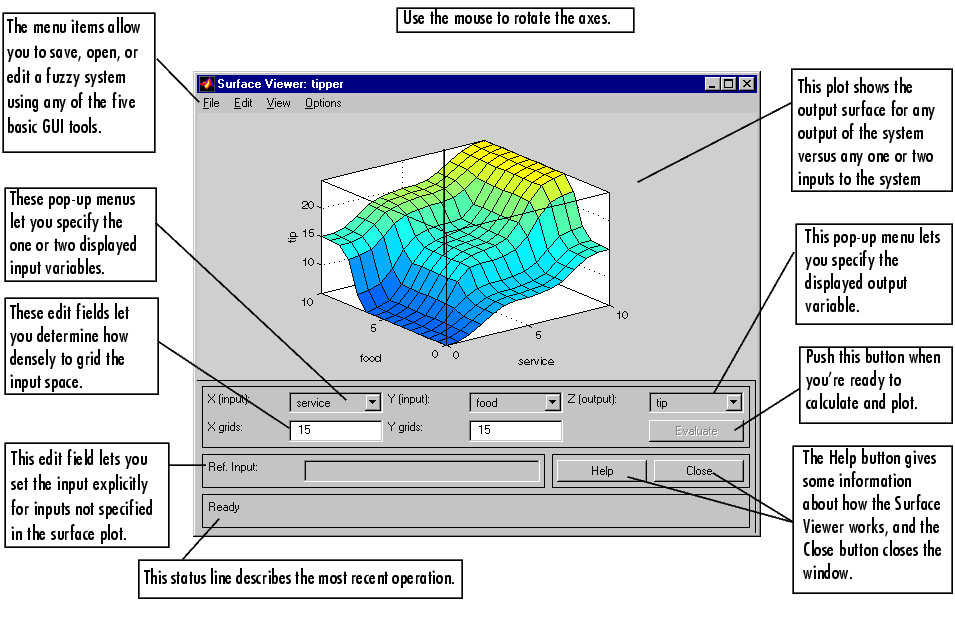
Upon opening the Surface Viewer, we are presented with a two-dimensional curve that represents the mapping from service quality to tip amount. Since this is a one-input one-output case, we can see the entire mapping in one plot. Two-input one-output systems also work well, as they generate three-dimensional plots that MATLAB can adeptly manage. When we move beyond three dimensions overall, we start to encounter trouble displaying the results. Accordingly, the Surface Viewer is equipped with pop-up menus that let you select any two inputs and any one output for plotting. Just below the pop-up menus are two text input fields that let you determine how many x-axis and y-axis grid lines you want to include. This allows you to keep the calculation time reasonable for complex problems. Pushing the Evaluate button initiates the calculation, and the plot comes up soon after the calculation is complete. To change the x-axis or y-axis grid after the surface is in view, simply change the appropriate text field, and click either X-grids or Y-grids, according to which text field you changed, to redraw the plot.
The Surface Viewer has a special capability that is very helpful in cases with two (or more) inputs and one output: you can actually grab the axes and reposition them to get a different three-dimensional view on the data. The Ref. Input field is used in situations when there are more inputs required by the system than the surface is mapping. Suppose you have a four-input one-output system and would like to see the output surface. The Surface Viewer can generate a three-dimensional output surface where any two of the inputs vary, but two of the inputs must be held constant since computer monitors cannot display a five-dimensional shape. In such a case the input would be a four-dimensional vector with NaNs holding the place of the varying inputs while numerical values would indicate those values that remain fixed. An NaN is the IEEE symbol for "not a number."
This concludes the quick walk-through of each of the main GUI tools. Notice that for the tipping problem, the output of the fuzzy system matches our original idea of the shape of the fuzzy mapping from service to tip fairly well. In hindsight, you might say, "Why bother? I could have just drawn a quick lookup table and been done an hour ago!" However, if you are interested in solving an entire class of similar decision-making problems, fuzzy logic may provide an appropriate tool for the solution, given its ease with which a system can be quickly modified.
| | The Rule Viewer | Importing and Exporting from the GUI Tools | |