| Financial Derivatives Toolbox | |
Using HJM Trees in MATLAB
When working with the HJM model, the Financial Derivatives Toolbox uses trees to represent forward rates, prices, etc. At the highest level, these trees have structures wrapped around them. The structures encapsulate information needed to interpret completely the information contained in a tree.
Consider this example, which uses the interest rate and portfolio data in the MAT-file deriv.mat included in the toolbox.
Load the data into the MATLAB workspace.
Display the list of the variables loaded from the MAT-file.
whosName Size Bytes ClassBDTInstSet 1x1 22708 struct array BDTTree 1x1 5522 struct array HJMInstSet 1x1 22700 struct array HJMTree 1x1 6318 struct array ZeroInstSet 1x1 14442 struct array ZeroRateSpec 1x1 1580 struct array
Structure of an HJM Tree
You can now examine in some detail the contents of the HJMTree structure.
HJMTree

HJMTree =

  FinObj: 'HJMFwdTree'
 VolSpec: [1x1 struct]
TimeSpec: [1x1 struct]
RateSpec: [1x1 struct]
    tObs: [0 1 2 3]
    TFwd: {[4x1 double]  [3x1 double]  [2x1 double]  [3]}
  CFlowT: {[4x1 double]  [3x1 double]  [2x1 double] [4]}
 FwdTree:{[4x1 double][3x1x2 double][2x2x2 double][1x4x2 double]}
FwdTree contains the actual forward rate tree. It is represented in MATLAB as a cell array with each cell array element containing a tree level.
The other fields contain other information relevant to interpreting the values in FwdTree. The most important of these are VolSpec, TimeSpec, and RateSpec, which contain the volatility, time structure, and rate structure information respectively.
First Node. Observe the forward rates in FwdTree. The first node represents the valuation date, tObs = 0.
Look closely at the RateSpec structure used in generating this tree to see where these values originate. Arrange the values in a single array.
[HJMTree.RateSpec.StartTimes HJMTree.RateSpec.EndTimes...
HJMTree.RateSpec.Rates]

ans =

         0    1.0000    0.0356
    1.0000    2.0000    0.0468
    2.0000    3.0000    0.0523
    3.0000    4.0000    0.0563
If you find the corresponding inverse discounts of the interest rates in the third column, you have the values at the first node of the tree. You can turn interest rates into inverse discounts using the function rate2disc.
Disc = rate2disc(HJMTree.TimeSpec.Compounding,...
HJMTree.RateSpec.Rates, HJMTree.RateSpec.EndTimes,...
HJMTree.RateSpec.StartTimes);
FRates = 1./Disc

FRates =
    1.0356
    1.0468
    1.0523
    1.0563
Second Node. The second node represents the first rate observation time, tObs = 1. This node displays two states: one representing the branch going up and the other representing the branch going down.
Note that HJMTree.VolSpec.NumBranch = 2.
HJMTree.VolSpec

ans =

          FinObj: 'HJMVolSpec'
    FactorModels: {'Constant'}
      FactorArgs: {{1x1 cell}}
      SigmaShift: 0
      NumFactors: 1
       NumBranch: 2
         PBranch: [0.5000 0.5000]
     Fact2Branch: [-1 1]
Examine the rates of the node corresponding to the up branch.
Now examine the corresponding down branch.
Third Node. The third node represents the second observation time, tObs = 2. This node contains a total of four states, two representing the branches going up and the other two representing the branches going down.
Examine the rates of the node corresponding to the up states.
Next examine the corresponding down states.
Isolating a Specific Node. Starting at the third level, indexing within the tree cell array becomes complex, and isolating a specific node can be difficult. The function bushpath isolates a specific node by specifying the path to the node as a vector of branches taken to reach that node. As an example, consider the node reached by starting from the root node, taking the branch up, then the branch down, and then another branch down. Given that the tree has only two branches per node, branches going up correspond to a 1, and branches going down correspond to a 2. The path up-down-down becomes the vector [1 2 2].
bushpath returns the spot rates for all the nodes touched by the path specified in the input argument, the first one corresponding to the root node, and the last one corresponding to the target node.
Isolating the same node using direct indexing obtains
As expected, this single value corresponds to the last element of the rates returned by bushpath.
You can use these techniques with any type of tree generated with the Financial Derivatives Toolbox, such as forward rate trees or price trees.
Graphical View of Forward Rate Tree
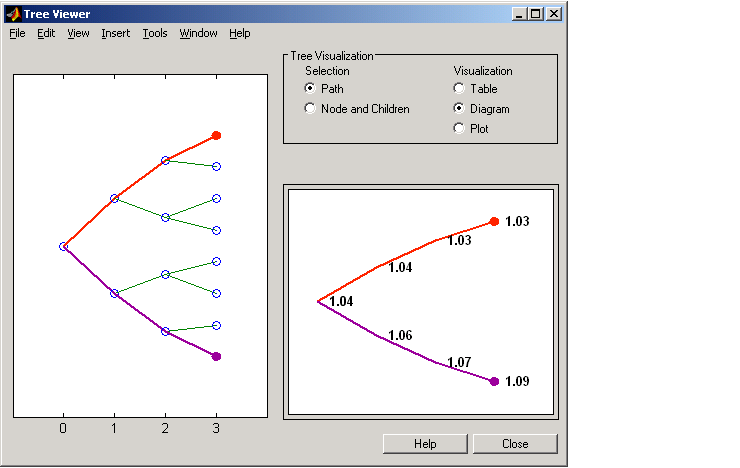
The function treeviewer provides a graphical view of the path of forward rates specified in HJMTree. For example, here is a treeviewer representation of the rates along both the up and the down branches of HJMTree.
A previous example used bushpath to find the path of forward rates taking the first branch up and then two branches down the rate tree.
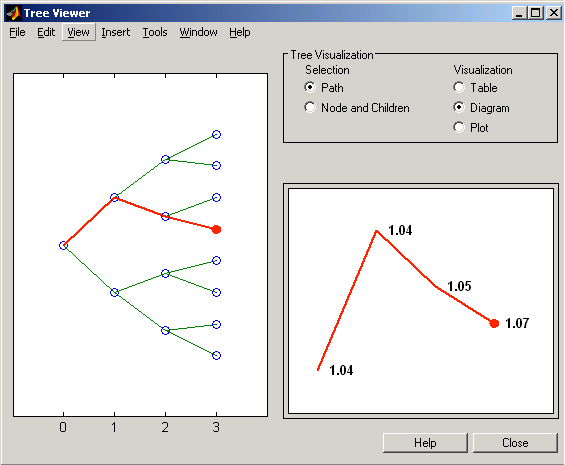
The treeviewer function displays the same information obtained by clicking along the sequence of nodes, as shown next.
Note
If you are not familiar with the use of treeviewer, see the treeviewer reference page for complete instructions on its use.
|
| | Heath-Jarrow-Morton (HJM) Model | Pricing and Sensitivity from HJM | |