| Excel Link | |
Example 3: Pricing a Stock Option with the Binomial Model
The MATLAB Financial Toolbox provides several functions that compute prices, sensitivities, and profits for portfolios of options or other equity derivatives. This example uses the binomial model to price an option. The binomial model assumes that the probability of each possible price over time follows a binomial distribution; that is, that prices can move to only two values, one up and one down, over any short time period. Plotting the two values, and then the subsequent two values each, and then the subsequent two values each, and so on, over time, is known as "building a binomial tree."
This example uses the Excel worksheet to organize and display input and output data. Excel Link functions copy data to a MATLAB matrix, calculate the prices, and return data to the worksheet.
| Note This example requires use of the optional MATLAB Financial Toolbox. |
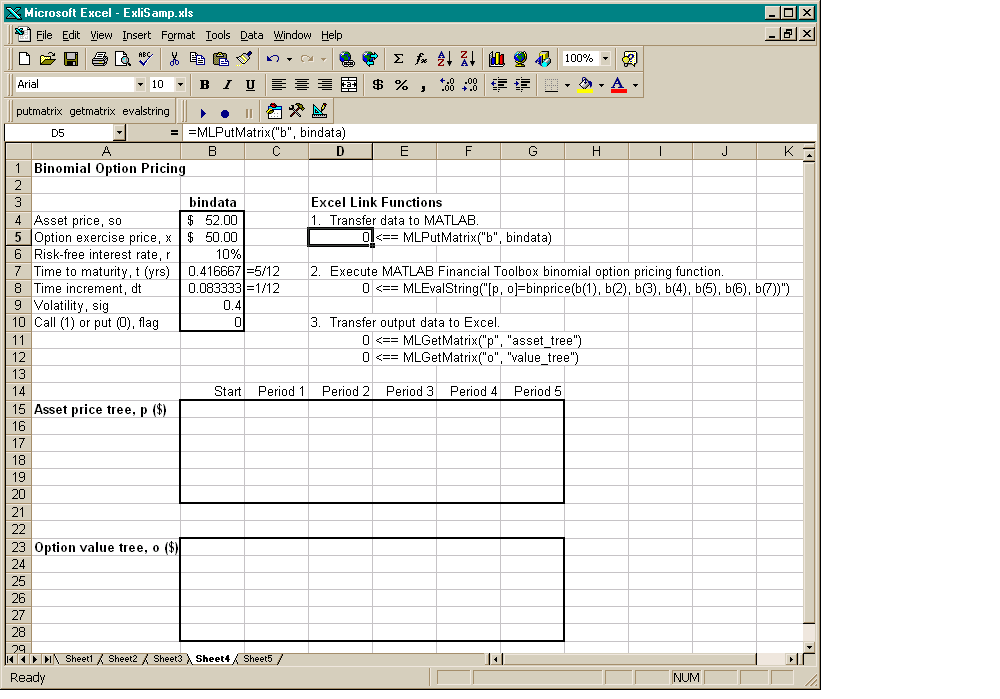
Click the Sheet4 tab on ExliSamp.xls to try this example.
The worksheet contains three named ranges.
B4:B10 |
named |
bindata |
B15 |
named |
asset_tree |
B23 |
named |
value_tree |
Also, two cells in bindata actually contain formulas.
B7 |
contains |
=5/12 |
B8 |
contains |
=1/12 |
Make D5 the active cell. Press F2, then Enter to execute the Excel Link function that copies the asset data to MATLAB. Move to D8 and execute the function that computes the binomial prices, then execute the functions in D11 and D12 to copy the price data to Excel.
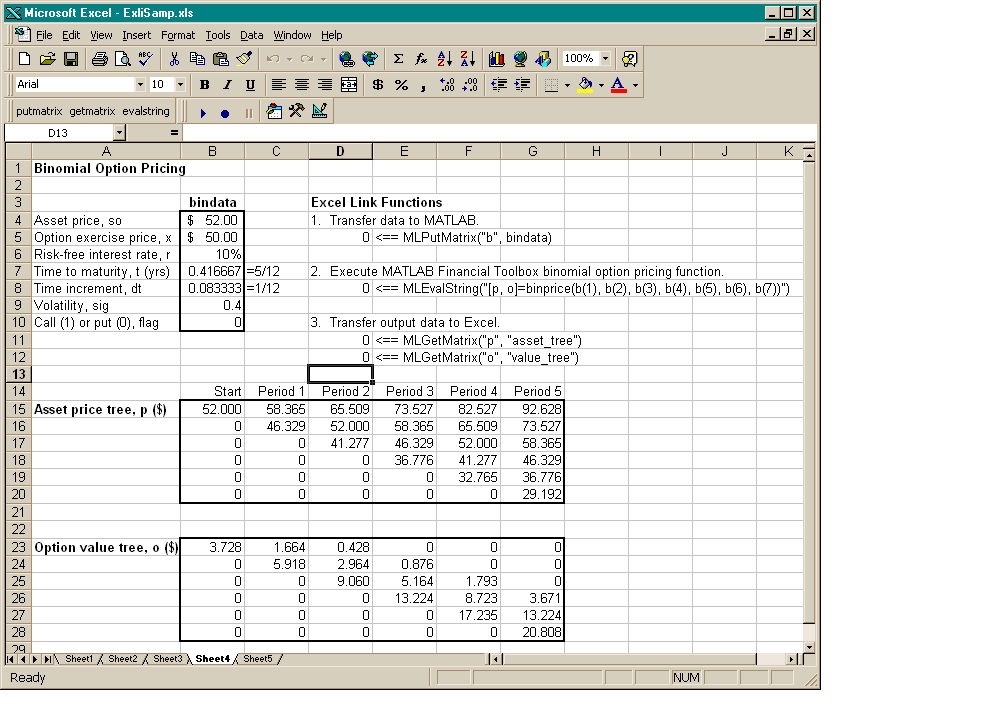
The worksheet looks like this.
Read the asset price tree this way: Period 1 shows the up and down prices, Period 2 shows the up-up, up-down, and down-down prices, Period 3 shows the up-up-up, up-up, down-down, and down-down-down prices, and so on. Ignore the zeros. The option value tree gives the associated option value for each node in the price tree. Because this is a put, the option value is zero for prices significantly above the exercise price. Ignore the zeros that correspond to a zero in the price tree.
Try changing the data in B4:B10 and re-executing the Excel Link functions. Note, however, that if you increase the time to maturity (B7) or change the time increment (B8), you may need to enlarge the output tree areas.
| | Example 2: Interpolating Data | Example 4: Calculating and Plotting the Efficient Frontier of Financial Portfolios | |