| Excel Link | |
Example 2: Interpolating Data
Interpolation is a process for estimating values that lie between known data points. It is important for applications such as signal and image processing and data visualization. MATLAB provides a number of interpolation functions that let you balance the smoothness of data fit with execution speed and efficient memory use.
This example uses a two-dimensional data-gridding interpolation function on thermodynamic data, where volume has been measured for time and temperature values. It finds the volume values underlying the two-dimensional time-temperature function for a new set of time and temperature coordinates.
The example uses an Excel worksheet to organize and display the original data and the interpolated output data. Excel Link functions copy the data to and from MATLAB, execute the MATLAB interpolation function, and invoke MATLAB graphics to display the interpolated data in a three-dimensional color surface.
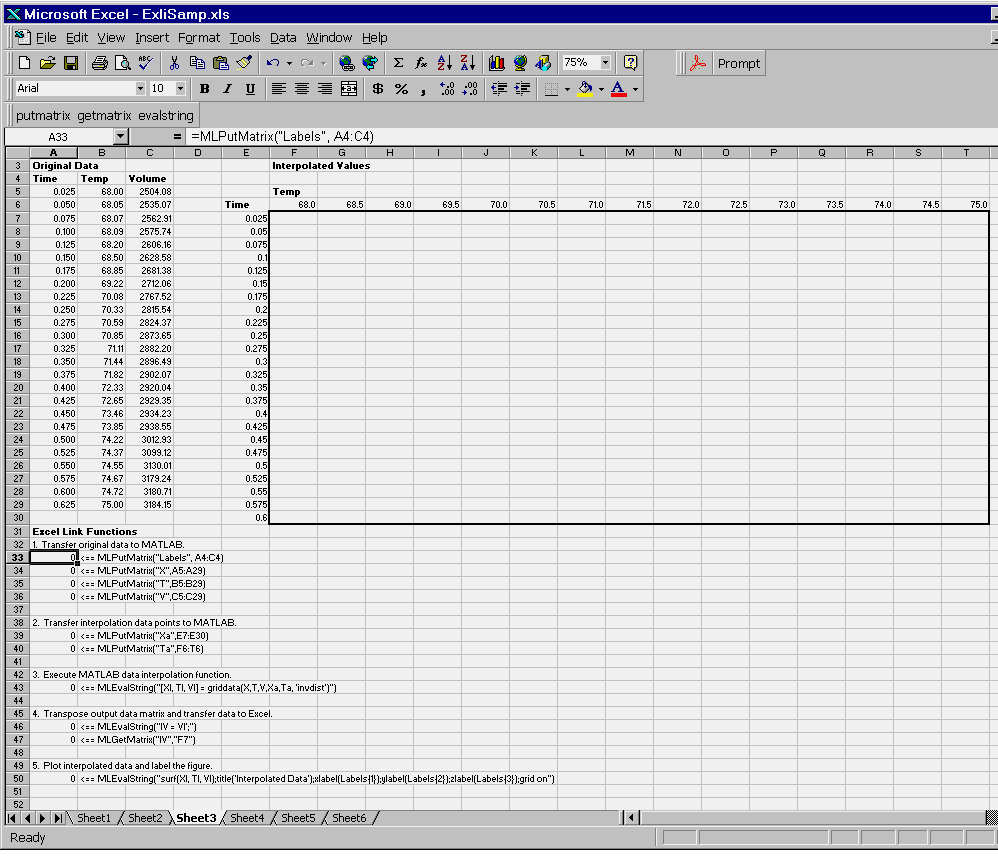
To try this example, click the Sheet3 tab on ExliSamp.xls.
The worksheet contains the measured thermodynamic data in cells A5:A29, B5:B29, and C5:C29. The time and temperature values for interpolation are in cells E7:E30 and F6:T6 respectively:
A33 the active cell. Press F2, then Enter to execute the Excel Link function that passes the Time, Temp, and Volume labels to MATLAB.
A34 the active cell. Press F2, then Enter to execute the Excel Link function that copies the original time data to MATLAB. Move to cell A35 and execute the function to copy the original temperature data. Execute the function in cell A36 to copy the original volume data.
A39 and press F2, then Enter to copy the interpolation time values to MATLAB. Execute the function in cell A40 to copy the interpolation temperature values.
A43. griddata is the MATLAB two-dimensional interpolation function that generates the interpolated volume data using the inverse distance method.
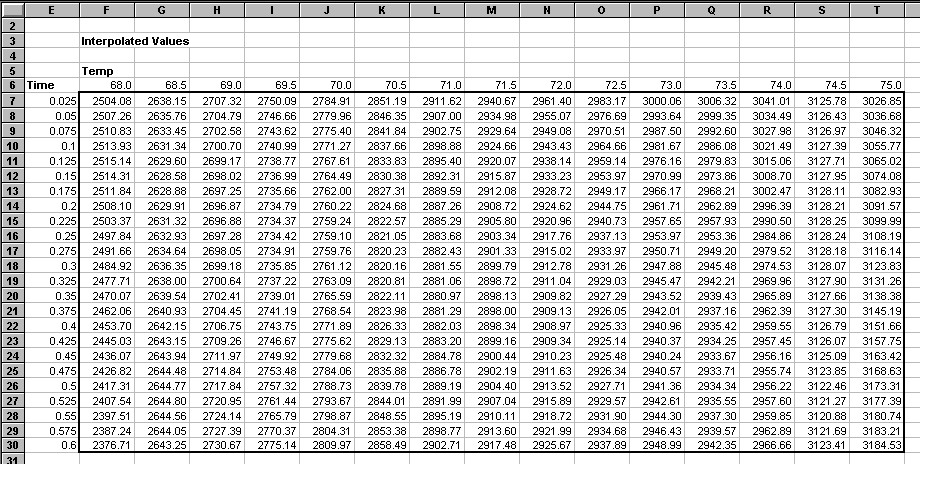
A46 and A47 to transpose the interpolated volume data and copy it to the Excel worksheet. The data fills cells F7:T30, which are enclosed in a border.
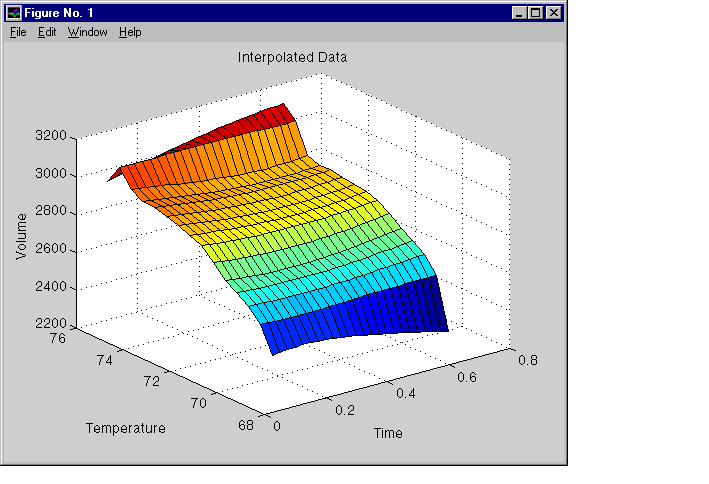
A50. MATLAB plots and labels the interpolated data on a three-dimensional color surface, with the color proportional to the interpolated volume data.
When you have finished with the example, close the figure window.
| | Using Excel Link | Example 3: Pricing a Stock Option with the Binomial Model | |