
| DSP Blockset |   |
Display a matrix as a color image.
Library
Description
The Matrix Viewer block displays an M-by-N matrix input by mapping the matrix element values to a specified range of colors. The display is updated as each new input is received. (A length-M 1-D vector input is treated as an M-by-1 matrix.)
Image Properties
Click on the Image properties check box to expose the image property parameters, which control the colormap and display.
The mapping of matrix element values to colors is specified by the Colormap matrix, Minimum input, and Maximum input parameters. For a colormap with L colors, the colormap matrix has dimension L-by-3, with one row for each color and one column for each element of the RGB triple that defines the color. Examples of RGB triples are
See ColorSpec in the MATLAB documentation for complete information about defining RGB triples.
MATLAB provides a number of functions for generating predefined colormaps, such as hot, cool, bone, and autumn. Each of these functions accepts the colormap size as an argument, and can be used in the Colormap matrix parameter. For example, if you specify gray(128) for the Colormap matrix parameter, the matrix is displayed in 128 shades of gray. The color in the first row of the colormap matrix is used to represent the value specified by the Minimum input parameter, and the color in the last row is used to represent the value specified by the Maximum input parameter. Values between the minimum and maximum are quantized and mapped to the intermediate rows of the colormap matrix.
The documentation for the MATLAB colormap function provides complete information about specifying colormap matrices, and includes a complete list of the available colormap functions.
Axis Properties
Click on the Axis properties check box to expose the axis property parameters, which control labeling and positioning.
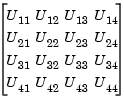
The Axis origin parameter determines where the first element of the input matrix, U(1,1), is displayed. When Upper left corner is specified, the matrix is displayed in matrix orientation, with U(1,1) in the upper-left corner.

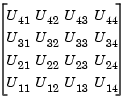
When Lower left corner is specified, the matrix is flipped vertically to image orientation, with U(1,1) in the lower-left corner.

Axis zoom, when selected, causes the image display to completely fill the figure window. Menus and axis titles are not displayed. This option can also be selected from the right-click pop-up menu in the figure window.
When Axis zoom is cleared, the axis labels and titles are displayed in a gray border surrounding the image axes, and the window's menus (including Axes) and toolbar are visible. The Plot Editor tools allow you to annotate and customize the image display. Select Help Plot Editor from the figure's Help menu for more information about using these tools. For information on printing or saving the image, or on the other options found in the generic figure menus (File, Edit, Window, Help), see the MATLAB documentation.
Figure Window
The image title (in the figure title bar) is the same as the block title. The axis tick marks reflect the size of the input matrix; the x-axis is numbered from 1 to N (number of columns), and the y-axis is numbered from 1 to M (number of rows).
In addition to the standard MATLAB figure window menus (File, Edit, Window, Help), the Matrix Viewer window has an Axes menu containing the following items:
Many of these options can also be accessed by right-clicking with the mouse anywhere on the displayed image. The right-click menu is very helpful when the scope is in zoomed mode and the Axes menu is not visible.
Examples
See the demo dspstfft.mdl for an example of using the Matrix Viewer block to create a moving spectrogram (time-frequency plot) of a speech signal by updating just one column of the input matrix at each sample time.
Dialog Box
hot or spring. See the ColorSpec property for complete information about defining RGB triples, and the colormap function for a list of colormap-generating functions. Tunable.U(1,1), is plotted; bottom left or top left. Tunable.[left bottom width height] specifying the position of the figure window, where (0,0) is the lower-left corner of the display. Tunable.Supported Data Types
To learn how to convert to the above data types in MATLAB and Simulink, see Supported Data Types and How to Convert to Them.
See Also
| Spectrum Scope |
DSP Blockset |
| Vector Scope |
DSP Blockset |
colormap |
MATLAB |
ColorSpec |
MATLAB |
image |
MATLAB |
Also see the following topics:
 | Matrix Sum | Maximum |  |