
| Data Acquisition Toolbox |   |
Acquiring Data with a Sound Card
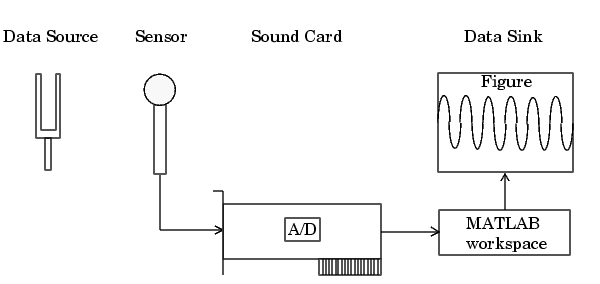
Suppose you must verify that the fundamental (lowest) frequency of a tuning fork is 440 Hz. To perform this task, you will use a microphone and a sound card to collect sound level data. You will then perform a fast Fourier transform (FFT) on the acquired data to find the frequency components of the tuning fork. The setup for this task is shown below.

Configuring the Data Acquisition Session
For this example, you will acquire 1 second of sound level data on one sound card channel. Because the tuning fork vibrates at a nominal frequency of 440 Hz, you can configure the sound card to its lowest sampling rate of 8000 Hz. Even at this lowest rate, you should not experience any aliasing effects because the tuning fork will not have significant spectral content above 4000 Hz, which is the Nyquist frequency. After you set the tuning fork vibrating and place it near the microphone, you will trigger the acquisition one time using a manual trigger.
You can run this example by typing daqdoc4_1 at the MATLAB command line.
AI for a sound card. The installed adaptors and hardware IDs are found with daqhwinfo.
AI.
blocksize and Fs, which are used for subsequent analysis. The actual sampling rate is retrieved because it might be set by the engine to a value that differs from the specified value.
duration = 1; %1 second acquisition
set(AI,'SampleRate',8000)
ActualRate = get(AI,'SampleRate');
set(AI,'SamplesPerTrigger',duration*ActualRate)
set(AI,'TriggerType','Manual')
blocksize = get(AI,'SamplesPerTrigger');
Fs = ActualRate;
AI, issue a manual trigger, and extract all data from the engine. Before trigger is issued, you should begin inputting data from the tuning fork into the sound card.
AI, you should remove it from memory and from the MATLAB workspace.
Analyzing the Data
For this example, analysis consists of finding the frequency components of the tuning fork and plotting the results. To do so, the function daqdocfft was created. This function calculates the FFT of data, and requires the values of SampleRate and SamplesPerTrigger as well as data as inputs.
daqdocfft outputs the frequency and magnitude of data, which you can then plot. daqdocfft is shown below.
function [f,mag] = daqdocfft(data,Fs,blocksize)
%    [F,MAG]=DAQDOCFFT(X,FS,BLOCKSIZE) calculates the FFT of X
%    using sampling frequency FS and the SamplesPerTrigger
%    provided in BLOCKSIZE

xfft = abs(fft(data));

% Avoid taking the log of 0.
index = find(xfft == 0);
xfft(index) = 1e-17;

mag = 20*log10(xfft);
mag = mag(1:floor(blocksize/2));
f = (0:length(mag)-1)*Fs/blocksize;
f = f(:);
plot(f,mag)
grid on
ylabel('Magnitude (dB)')
xlabel('Frequency (Hz)')
title('Frequency Components of Tuning Fork')

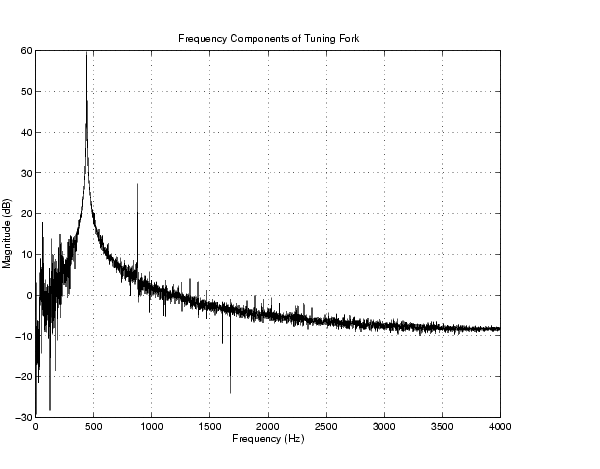
The plot shows the fundamental frequency around 440 Hz and the first overtone around 880 Hz. A simple way to find actual fundamental frequency is
 | Analog Input Examples | Acquiring Data with a National Instruments Board |  |