| Communications Blockset | |
Learning More About the Gray Coding Demo
To learn more about a particular library block in this model, see its reference page in the Communications Blockset documentation. If you have the model open, then you can click the Help button in the block's dialog box to display the reference page.
The rest of this section indicates how you can analyze the data that the demo produces to compare theoretical performance with simulation performance.
Data Analysis Using the Demo
The theoretical symbol error probability of MPSK is given by
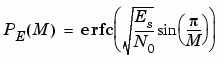
where erfc is the complementary error function, Es/No is the ratio of energy in a symbol to noise power spectral density, and M is the number of symbols.
To determine the bit error probability, the symbol error probability, PE, needs to be converted to its bit error equivalent. There is no general formula for the symbol to bit error conversion. Upper and lower limits are nevertheless easy to establish. The actual bit error probability, Pb, can be shown to be bounded by
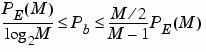
The lower limit corresponds to the case where the symbols have undergone Gray coding. The upper limit corresponds to the case of pure binary coding.
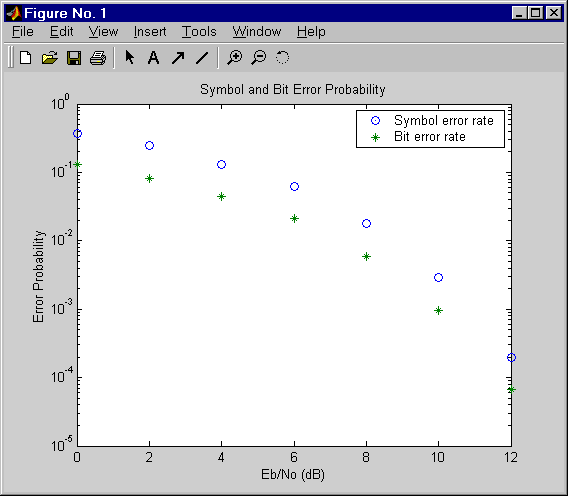
Simulation Results. To test the Gray code modulation scheme in this model, simulate the tstgraycod model for a range of Eb/No values. Because increasing the value of Eb/No lowers the number of errors produced, the length of each simulation must be increased to ensure that the statistics of the errors remain stable.
Using the sim command to run a Simulink simulation from the MATLAB command window, the following code generates data for symbol error rate and bit error rate curves. It considers Eb/No values in the range 0 dB to 12 dB, in steps of 2 dB.
M = 8;
Tsym = 0.2;
Tsample = 0.01;
BERVec = [];
SERVec = [];
EbNoVec = [0:2:12];
TVec = [1000 1000 1000 15000 20000 100000 100000]*Tsym;
for n=1:length(EbNoVec);
   Tmax = TVec(n);
   EbNodB = EbNoVec(n);
   sim('tstgraycod');
   SERVec(n,:) = SER;
   BERVec(n,:) = BER;
end;
After simulating for the full set of Eb/No values, you can plot the results using these commands:
semilogy(EbNoVec,SERVec(:,1),'o',EbNoVec,BERVec(:,1),'*');
legend('Symbol error rate','Bit error rate');
xlabel('Eb/No (dB)'); ylabel('Error Probability');
title('Symbol and Bit Error Probability');
Comparison with Pure Binary Coding and Theory. As a further exercise, you can plot the theoretical curves on the same axes with the simulation results. You can also compare Gray coding with pure binary coding, by modifying the M-PSK Modulator Baseband and M-PSK Demodulator Baseband blocks so that their Constellation ordering parameters are Binary instead of Gray.
| | Components of the Gray Coding Demo | Discrete Multitone Signaling Demo | |