

| GUI Reference | |
Select Design Constraints to open the Design Constraints window, which is shown below.
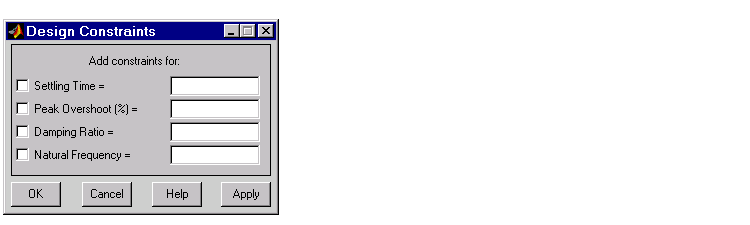
You have the following options:
Specifying any of these design constraints causes lines or circles to appear in the root locus diagram. In each case, to specify the constraint, enter the value in the field next to the option. The box to the left of the design constraint automatically checks when you press Enter. To deactivate the feature, uncheck the box and press OK or Apply.
If you specify a settling time, a vertical line appears on the root locus plot at the pole locations associated with the value provided (using a second-order approximation).
Peak Overshoot
Specifying peak overshoot causes two lines, starting at the root locus origin, to appear. These lines are the locus of poles associated with the value provided (using a second-order approximation).
Specifying a damping ratio causes two lines, starting at the root locus origin, to appear. These lines are the locus of poles associated with the damping ratio.
If you specify a natural frequency, a circle centered around the root locus origin appears. The radius equals the natural frequency.
| | Edit Compensator | Grid | |