
| Customization |   |
Options Page
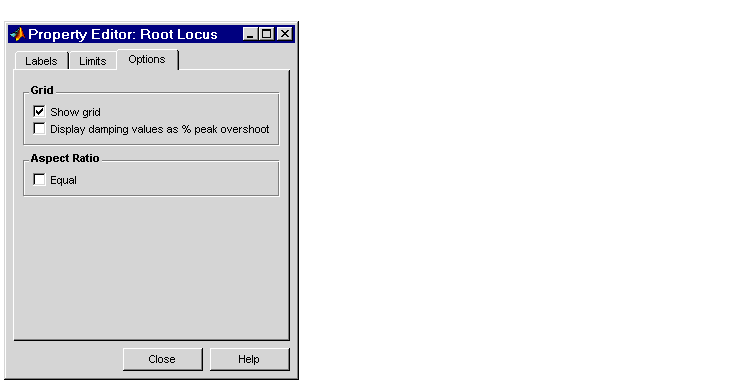
The Options page contains settings for adding a grid and changing the plot's aspect ratio. This figure shows the Options page.
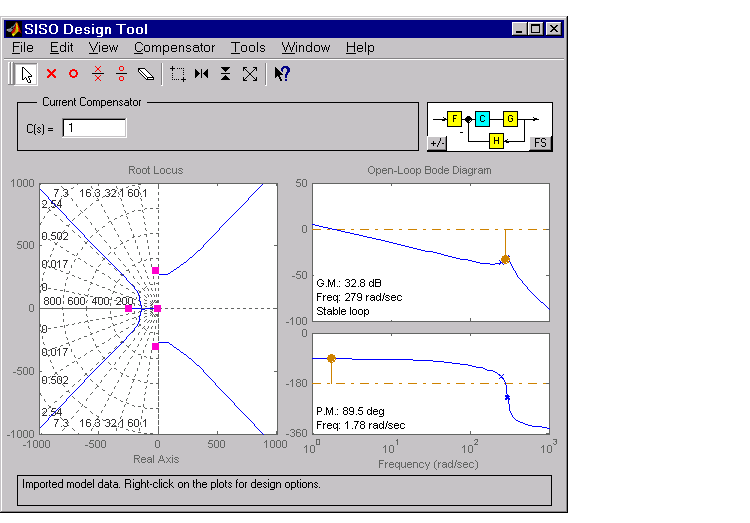
Check Show grid to display a grid on the root locus. If you select Display damping ratios as % peak overshoot, the SISO Design Tool displays the damping ratio values along the grid lines. This figure shows both options activated for an imported model, Gservo. If you want to verify these settings, type
load ltiexamples
at the MATLAB prompt and import Gservo from the workspace into your SISO Design Tool.

Figure 3-3: Displaying Damping Ratio Values
The numbers displayed on the root locus gridlines are the damping ratios as a percentage of the overshoot values.
If you check the Equal box in the Aspect Ratio panel, the x and y-axes are set to equal limit values.
 | Limits Page | Opening the Bode Diagram Property Editor |  |