| Real-Time Windows Target | |
Plotting Logged Signal Data
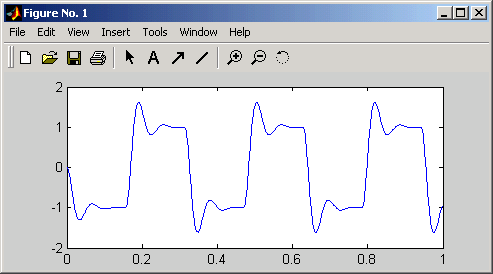
You can use the MATLAB plotting functions for visualization of your nonreal-time simulated data or your real-time executed data.
After running your real-time application and logging data to a disk drive, you can plot the data. This procedure uses the Simulink model rtwin_model.mdl as an example, and assumes you saved your data to the variable ScopeData:
ScopeData. The variable ScopeData is a MATLAB structure containing the fields time vector, signal structure, and a string containing the block name.
| | Entering Data Archiving Parameters | Parameter Tuning | |