
| Target Language Compiler |   |
Using the TLC Debugger
This section provides a tutorial that illustrates the steps for invoking and using the TLC debugger with Simulink and Real-Time Workshop generated code. The files and models for this example are in
This tutorial uses the simple_log model and the gain.tlc TLC file located in this directory.
For the purpose of this tutorial, the TLC file contains a bug, so this function cannot be used in actual practice.
Generate the Results
simple_log model, which contains a Gain block. Note that the gain.tlc used here will be the one in the current directory as the model. This is the simple_log model.
tout and yout to the workspace, which you can view by selecting View -> Workspace from the MATLAB Desktop.
simple_log.mat. (For more information about the build process, see the Real-Time Workshop documentation.)
simple_log.mat file. The result from Simulink, yout, does not match the Real-Time Workshop result, rt_yout, because the TLC code contains a bug. You must debug the TLC code to identify the problem.
Invoke the Debugger
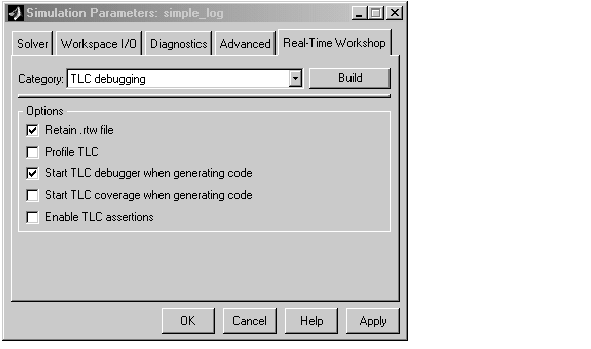
TLC debugging from the Category pull-down menu. From this screen you can select options that are specific to TLC debugging.
model.rtw file is not deleted after code generation.

-dc to the System target file field in the Real-Time Workshop pane of the Simulation Parameters dialog box.
TLC_DEBUG>
You can now set breakpoints, explore the contents of Real-Time Workshop files, and explore variables in your TLC file using print, which, or whos.
An alternate way to invoke the TLC debugger is from the MATLAB prompt. (This assumes you retained the model.rtw file in the project directory.) To avoid making mistakes, we recommend copying the tlc command output by Real-Time Workshop to the MATLAB command window, and issue it after appending -dc to that command line.
A complete list of command line switches for the TLC debugger is found in Table 6-8, Target Language Compiler Switches,.
 | About the TLC Debugger | TLC Debugger Command Summary |  |